지금 지원 담당자와 채팅
지원 담당자와 채팅

Foglight for Sybase 5.9.3.10 - User and Reference Guide

Using Foglight for Sybase
Exploring the Sybase Dashboards About the Sybase_MDA Agent About the Sybase_RS Agent Generating SybaseMDA Reports
Reference

System Wait Events Tab

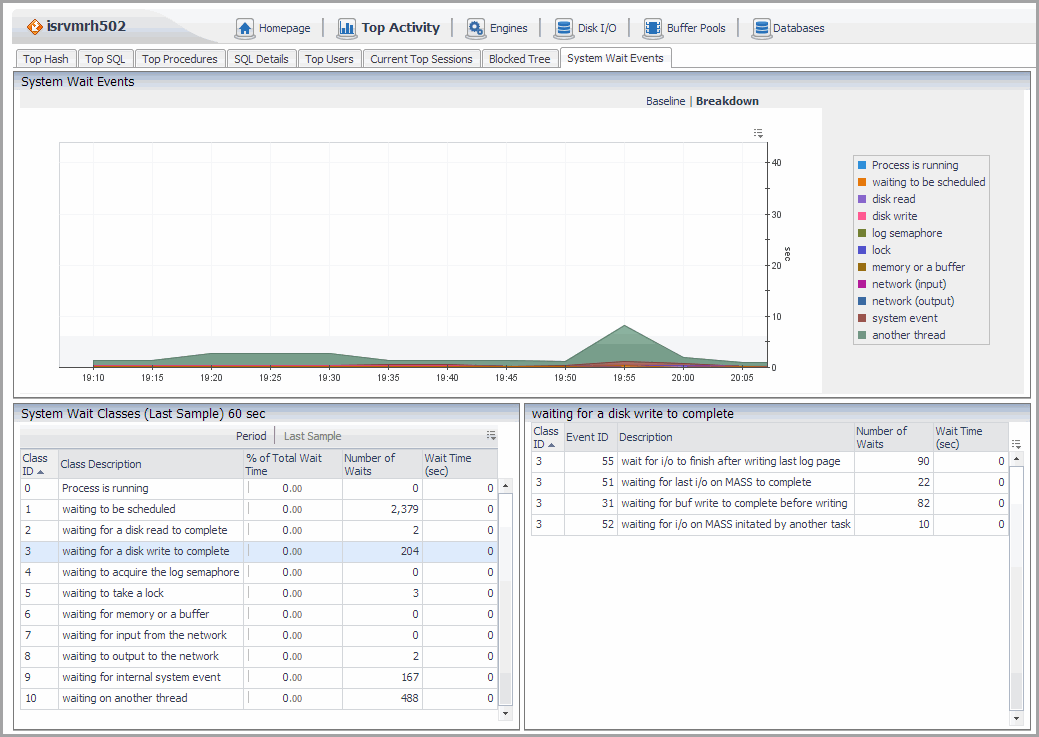
The System Wait Events tab information is provided in a chart and two tables:
System Wait Classes

The following wait classes, plotted over time:

You can choose to display the system wait classes for either:

The columns are common for both the Show Last Sample and Show Time Range tables.

You can view detailed information for a wait class by clicking a row in the System Wait Classes table. The detailed information appears in the Wait Events Details Table, located at the bottom-right of the screen at the next data refresh.

Class ID

A sequential number for the class identifier.

Class Description

The description of the class:

% of Total Wait Time

The percentage total wait time for this class.

Number of Waits

The number of waits for this class.

Wait Time (sec)

The wait time for this class in seconds.

The content of this table is determined by the selection made in the System Wait Classes Table.

Class ID

A sequential number for the class identifier.

Event ID

The event identifier number.

Description

The description of the wait event; for example:

Number of Waits

The number of waits for this event.

Wait Time (sec)

The wait time for this event in seconds.

Spinlocks Tab

ASE uses spinlocks as synchronization mechanisms in SMP environment in order to protect shared resources. Use this dashboard to find areas where spinlock are a contention and tune their configuration. Data is available for Sybase version ASE 15.7 ESD#2 and above.

To monitor spinlocks, enable the ‘Enable spinlock monitoring’ Sybase configuration parameters using the following command:

sp_configure "enable spinlock monitoring", 1

The dashboard shows the following type of objects in which ASE applies the spinlock mechanism:

For information about Data Caches Spinlock Contention, refer to the Buffer Pools Dashboard .

Name

Name of spinlock

Contention

Spinlock contention as percentage of waits in grabs.

Grabs

Number of grabs of this spinlock

Spins

Number of spins of this spinlock

Waits

Number of waits of this spinlock

Spins per wait

Number of spins per wait.

Execution Time Tab

This dashboard shows the execution time of each of the following operations performed in an instance:

Use this dashboard to understand where does the instance spends most of its time and to analyze trends in its behavior. Data is available for Sybase version ASE 15.7 SP100 and above.

Module

Name of operation category.

Execution Time

Execution time, in microseconds, of each operation performed.

Execution Count

Total number of this operation type that took place.

Engines Dashboard

The Engines dashboard provides performance details for Engine operations. This dashboard contains the following:

관련 문서

The document was helpful.

평가 결과 선택

I easily found the information I needed.

평가 결과 선택