-
제목
How to programmatically monitor system availability -
해결 방안
System availability overview
Overall stability and availability of a machine in a specific time range is usually called system uptime. This measurement represents a period (sometimes percentage) when the system is stable and performing without unattended reboots, except for maintenance and administrative purposes, and works without issues. The opposite, system downtime is a period when machine is turned off (on purpose), or encounters experiences problems that result is the system being unavailable to users and processes. The combination of these two measurements is called system availability which is both identified and tracked with Windows Event Viewer (System Log).
A crucial concern related to the system availability monitoring is: how long the system is running and/or why it stopped at the specific moment. The bigger and more complex the system is, the more important it is to check the ratio of uptime/downtime and monitor it thoroughly. Uptime expectations can vary between 95%-99.999%, based on ideal (and expected) projections of machine availability.
Methods for checking and monitoring the system availability status
There are several approaches to determine system uptime/downtime, manually and programmatically.
Checking uptime visually with Windows Task Manager
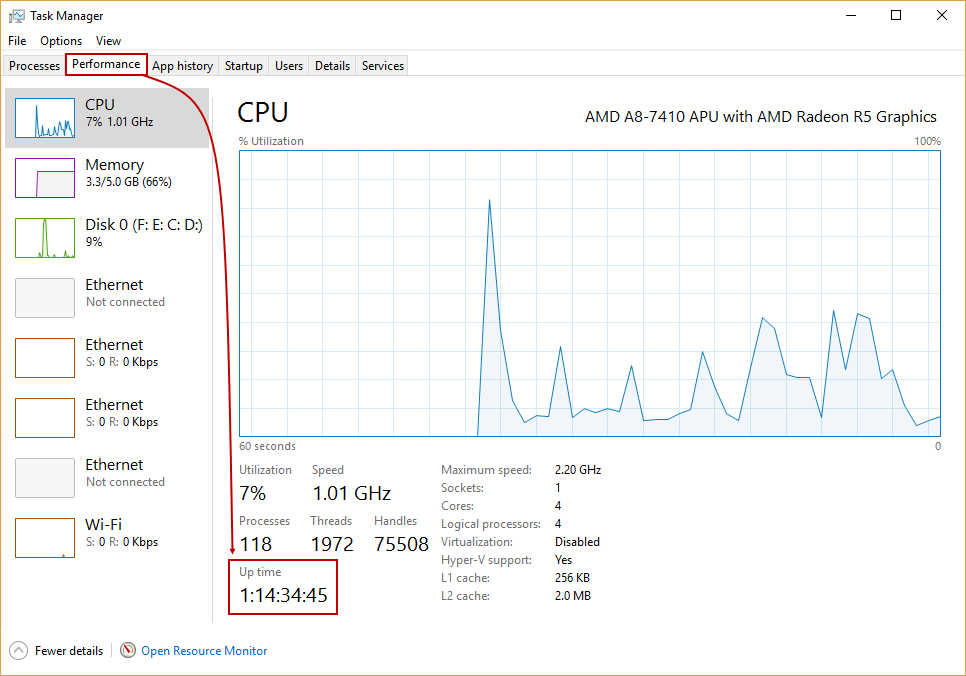
There is information about current uptime (which means since the last system boot) in the Performance tab in Windows Task Manager, within CPU thread:
(Note that above is the screenshot from Windows 10, and position of the uptime information may vary slightly depending on Windows version, but always with the same format: H:MM:SS:tt)
Checking uptime programmatically with PowerShell
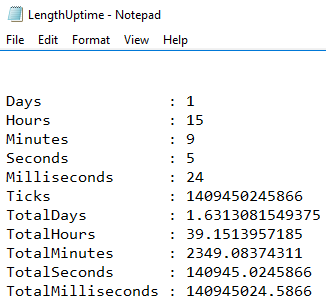
This script will show the length of uptime since the last boot, and generate a Text file with that information:
(get-date) - (gcim Win32_OperatingSystem).LastBootUpTime | Out-File "d:\LengthUptime.txt"
The results will appear like this:
Also, the information when the system initially booted can be fetched with this script:
((Get-WmiObject Win32_OperatingSystem).ConvertToDateTime((Get-WmiObject Win32_OperatingSystem).LastBootUpTime)) | Out-File "d:\LastBootUpTime.txt"

Pinging the remote machine as a pre-check for availability
To check the and monitor availability of the remote machine, ping it, and read results in Text file:
Test-Connection "<name_of_the_machine>" | Out-File "d:\RemoteAvailability.txt"
Pinging the remote machine doesn’t provide valid information on real system availability, because it is expected that the machine answers to the sent ping, and the real status is unreachable at that point. To see the exact time of the remote machine’s last boot up time.
$LastBootUpTime = Get-WmiObject Win32_OperatingSystem -Comp <name_of_the_remote_machine> | Select -Exp LastBootUpTime [System.Management.ManagementDateTimeConverter]::ToDateTime($LastBootUpTime) | Out-File "d:\RemoteLastBootUpTime.txt"

Finally, use this script for the system uptime information from the remote machine, displaying the number of days, hours, minutes and seconds how long system is running:
((Get-Date) - ([wmi]'').ConvertToDateTime((Get-WmiObject win32_operatingsystem -Comp <machine_name> LastBootUpTime)).ToString("dd\-hh\:mm\:ss") | Out-File "d:\RemoteLengthUptime.txt"

Parsing the Event Viewer log for uptime/downtime errors
Previous examples were only meant to determine the last boot time and uptime for machines. Although there are many events that relate to uptime/downtime, the focus in this article will be on exact moments when the user logs in and logs out. To get more accurate information on these events you will need to analyze the Windows Event Viewer's System log.
These events have a unique IDs, which reveal the level (type of information), date and time, source (the event handler), the true reason of the particular system availability behavior, and specific time span when they occurred. We’ll focus on some of them, displayed in the grid below:
ID Source Level of severity* Description 7001 Winlogon Information This event represents the moment when user logs in. 7002 Winlogon Information This event represents the moment when user logs off. * In Level of severity column, the information in brackets represents the System log’s schema for naming levels of severity (Error, Information, etc.).
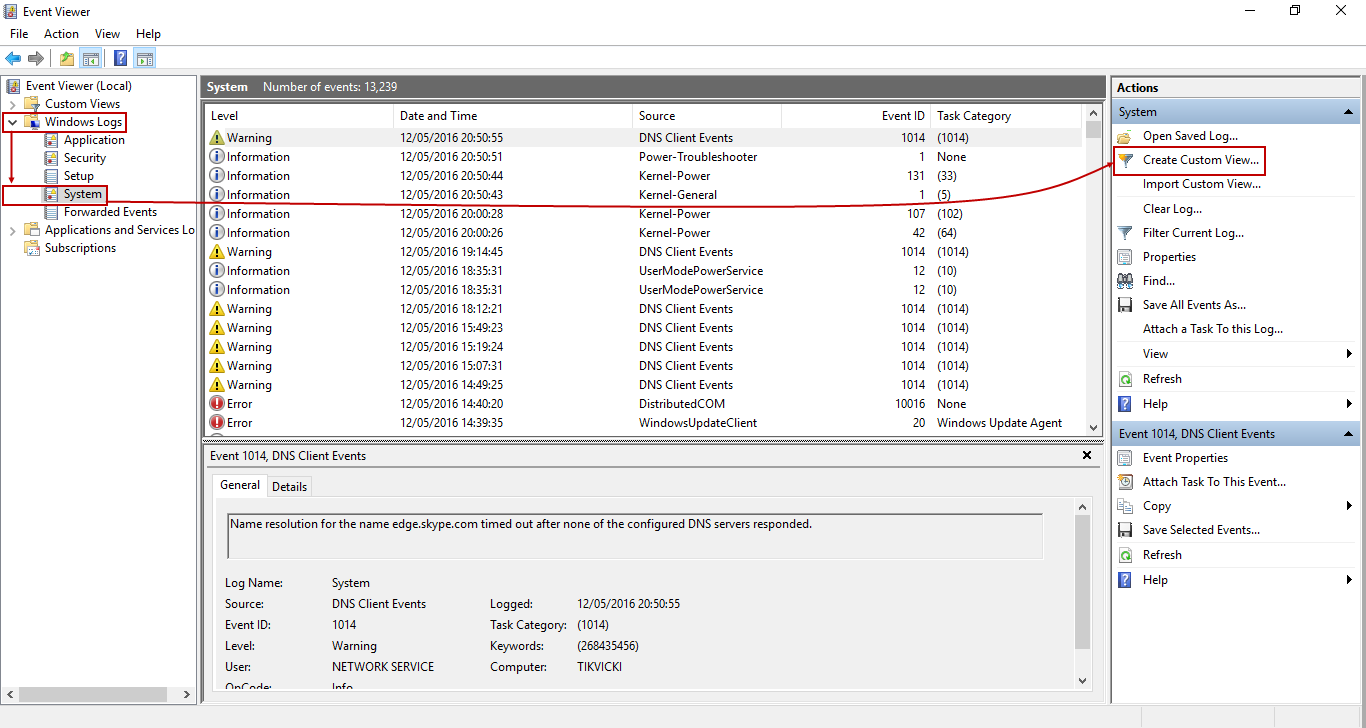
To examine the System log further, run the eventvwr.msc, and choose Windows Logs -> System:
Create a custom view, in order to filter down to only the desired events with a particular Event ID, by clicking Create Custom View, like shown above. The new dialog will appear, select and input like shown below:
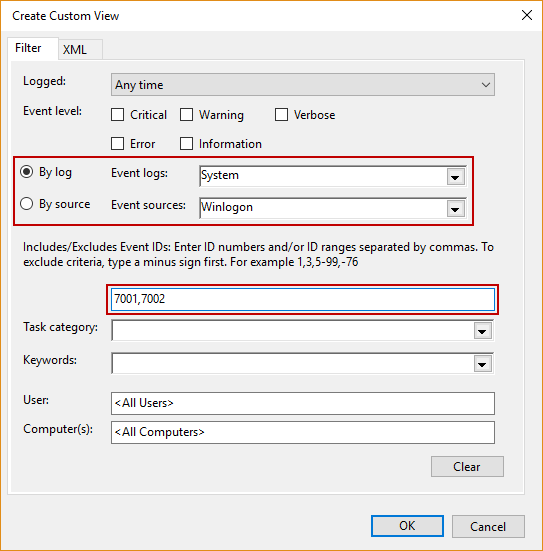
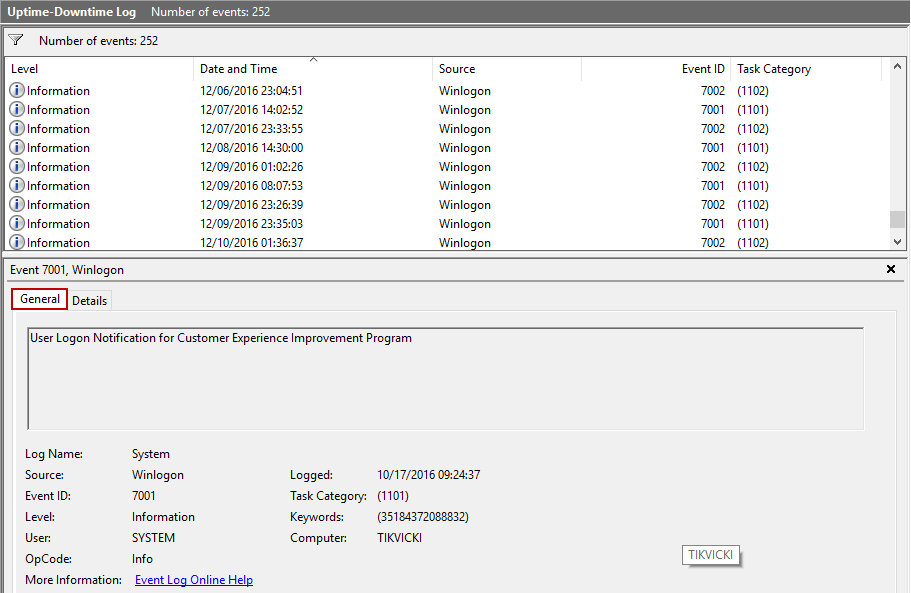
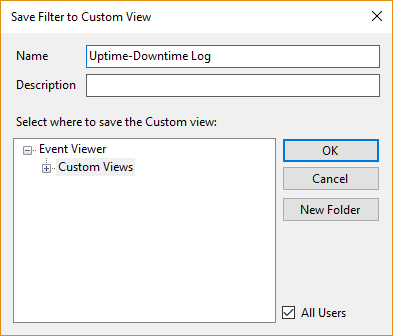
This filter for the custom view can be also saved (in this case, it will be titled Uptime-Downtime Log):
Sort the events by Date and Time, and examine particular event within collected information in General and Details tab, if needed:
As can be seen, details about events mentioned above are fully present here in the System log, which can be exported and used for further analysis.
Constant monitoring of system availability with ApexSQL Monitor
ApexSQL Monitor’s System availability feature automatically tracks system uptime, or in other words, it informs the user if the system is available for use or not. It is also offers special performance counters, like SQL Server Agent status relevant to uptime monitoring.
There are several methods to check and monitor the system availability in ApexSQL Monitor, which include setting particular alert actions to emphasize monitoring process.
System availability review in the ApexSQL Monitor dashboard
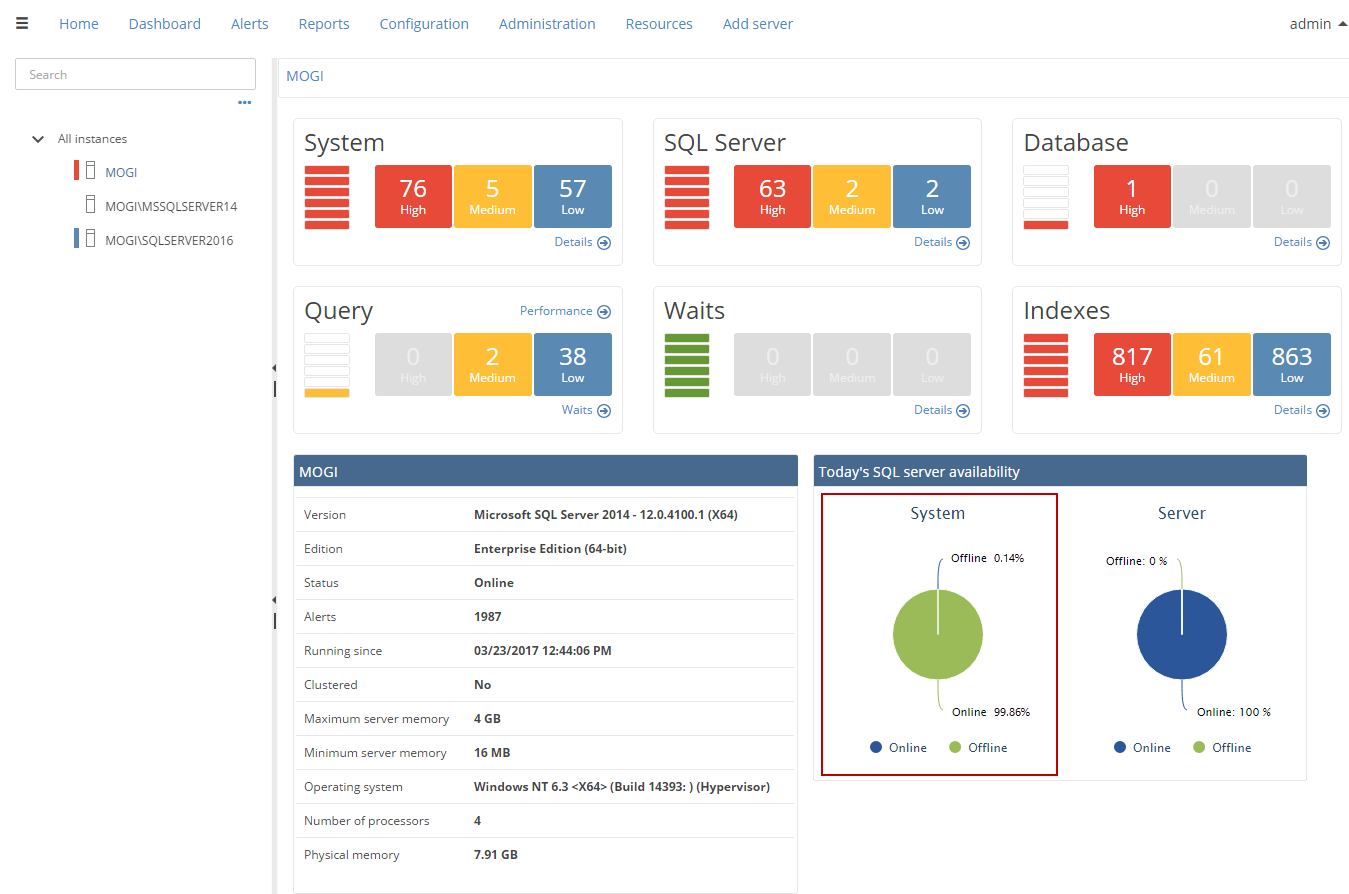
Select a SQL Server instance, and the pie chart entitled System in the Dashboard will display information as shown in picture below:
As can be seen, the system availability shows as ratio of Available (99.86%)/Unavailable (0.14%) for the current date.
System availability metric
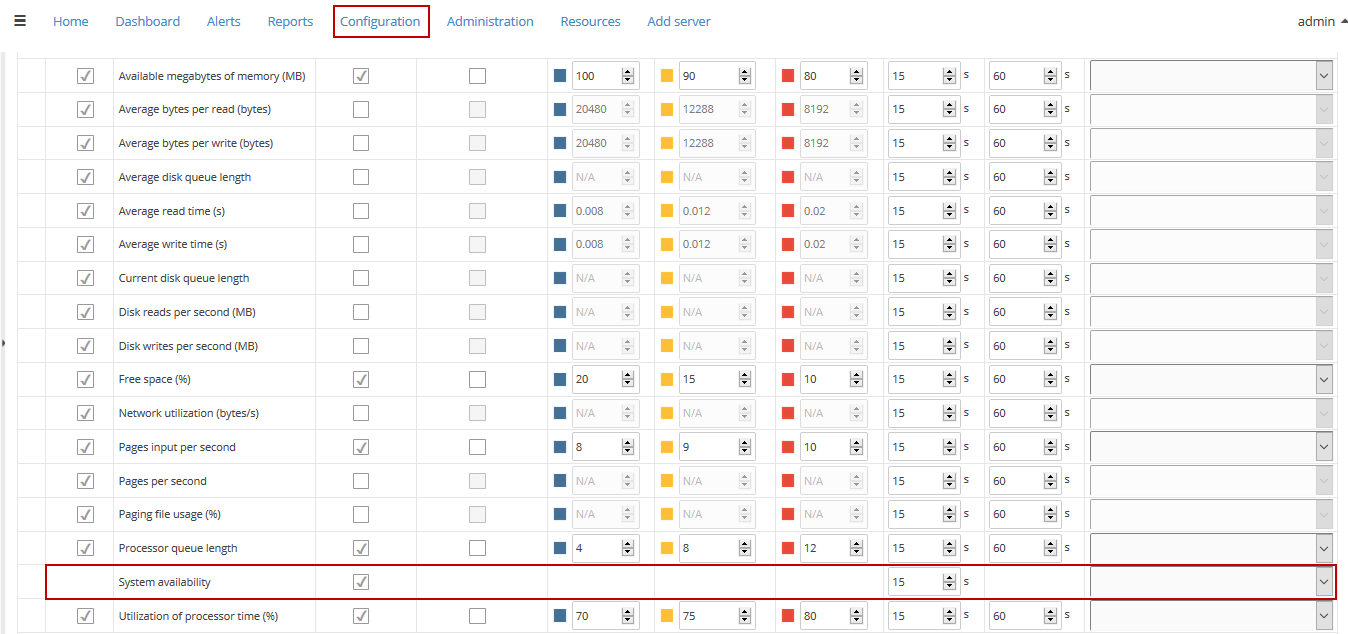
The system availability metric is part of the System performance metrics group in Configuration subsystem:
Like other special counters (e.g. SQL Server Agent status metric), it does not have settings for custom thresholds on any level and custom alert period, because it raises alert just on one type of status change (available/unavailable).
Checking the time span of availability in Alerts subsystem
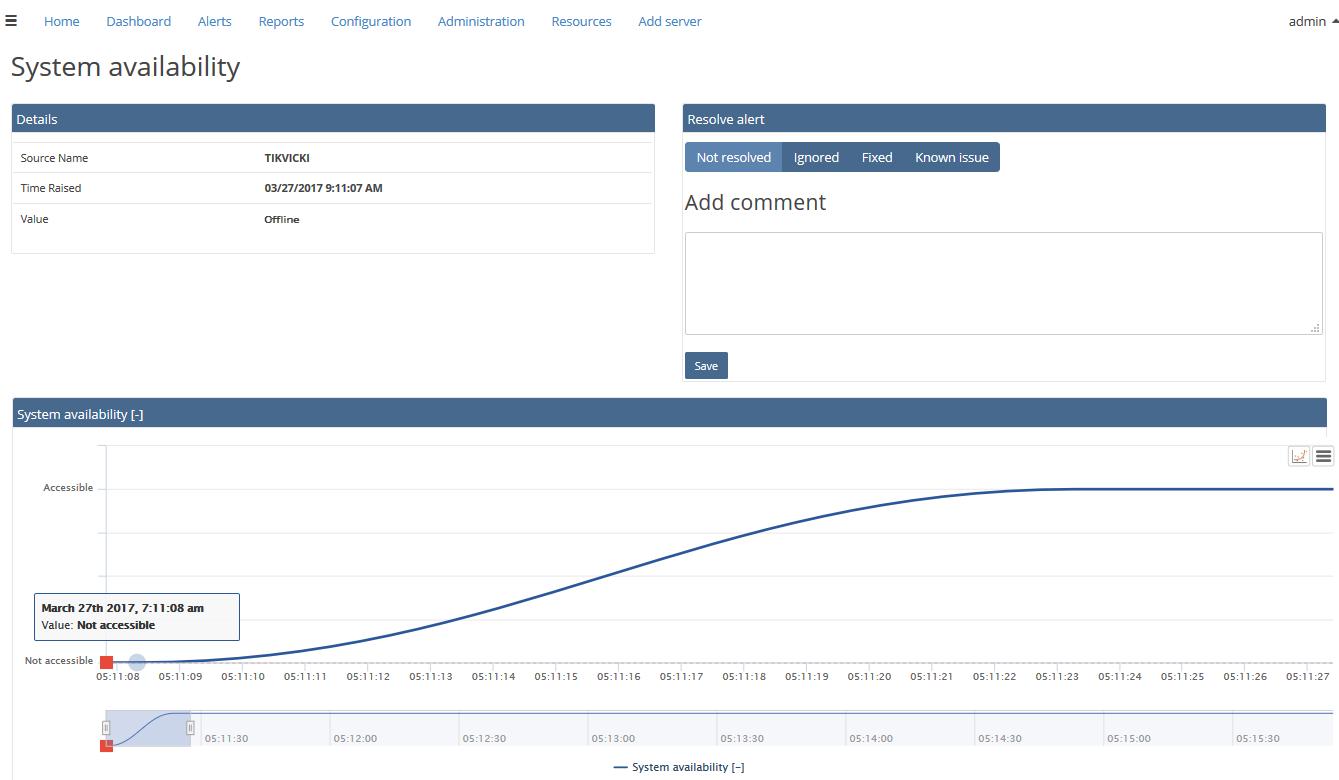
To determine time span of availability, and moment(s) of unavailability, review and resolve alerts related to System availability counter within Alerts subsystem:
In the picture below, the marked alert indicates the event that occurred when the system was unavailable, and then became available:
In ApexSQL Monitor, the scale present in the graph for this metric is Accessible and Not Accessible states, which corresponds with the states of changing from unavailable to available (which represents the Accessible state) and vice versa.
It was mentioned above to pay attention on Winlogon events with IDs 7001 and 7002. The reason is that ApexSQL Monitor similarly tracks the moments when user logs in and logs off, and System availability counter is connected to background labor of the ApexSQL Monitor service, which acts as an alert firing module.
To document, put a comment within the alert and then resolve it. After that, generate a Resolved alerts report, if needed.
Automating alert actions system availability checks
The most basic automation task would be to set an email alert on the system availability changed state in ApexSQL Monitor, and if there is need to perform other actions, custom command alert actions (including PowerShell scripts) can help automate these tasks.
Automatically ping the remote machine and check availability
The previously mentioned script for pinging the remote machine can be used to log the current availability of the machine, if it is included in custom command alert:
Powershell.exe “Test-Connection <name_of_the_machine> | Out-File d:\RemoteAvailability.txt”
Extract other uptime/downtime events with specific IDs and emphasize the investigation of system availability
Use this PowerShell script to generate the Extra Uptime Downtime Events Log, with customized date (follow this format in the input), and include it in custom command alert action:
powershell.exe “Get-WinEvent -FilterHashtable @{logname=’system’;id=6008,6009;StartTime="MM/DD/YY";EndTime="MM/DD/YY";} -ErrorAction SilentlyContinue | Out-File d:\ExtraUptimeDowntimeEventsLog.txt -Append -Force”
Results should show like this:
The explanation about mentioned IDs are in this grid below:
ID Source Level of severity Description 6008 EventLog High (Error) This event is present when system starts after the unexpected shut down. 6009 EventLog None (Information) User-initiated reboot (using CTRL+ALT+DEL, e.g.). Useful resources:

