-
제목
How to monitor SQL Server failover events automatically -
해결 방안
Failover event overview
In general, the term “failover” refers to switching from a previously active machine, other hardware component, or network to a passive (or unused) one, to sustain high availability and reliability. In most cases, a failover event is an automatic process, while a the similar event, switchover, requires manual intervention in switching between the active/passive elements.
Failover incorporated into high-availability configurations in SQL Server (from 2012 version and above). In this article, the Failover Cluster Instance (as part of the Windows Server Failover Clustering server group, abbrev. WSFC) will be covered, to show how to monitor SQL Server failover events when they occur.
SQL Server Failover Cluster Instance
A Failover Cluster Instance (FCI) is server-based instance which acts like regular a SQL Server instance, but it is installed on a multitude of WSFC nodes. These nodes present connection points in FCI, and they are usually physical machines with similar characteristics (e.g., hardware configuration, OS). Their hierarchy and working configuration is by default, set as group of active and passive nodes. Although the FCI resembles a single-machine running instance (if used remotely), it leverages the high availability and manages failover process between active and passive nodes, in moments when one of them become unavailable.
In a SQL Server FCI, the failover process itself is automatic by default, but this process can be manually initiated, if needed, e.g. when it comes to the maintenance of the whole server, or particular node (machine).
Determine when failover event(s) occurred
In this article, as previously stated, the focus will be on the SQL Server failover events occurrence and their monitoring. The direct monitoring of the failover events is not possible related to them can be done programmatically.
Check which FCI node is active (T-SQL)
Determine which node is currently active in FCI with this script (Cluster nodes system view):
SELECT NodeName,
	STATUS AS NodeStatus,
	status_description AS NodeStatusDescription,
	is_current_owner AS CurrentlyActiveNode
FROM sys.dm_os_cluster_nodes
The failover event in FCI is actually tracked during the role change between the nodes (when one node become passive, and next node become active). At this point, the time when the failover occurred is unknown. This script reveals the active node, but it can also show in which state the other nodes are in, like in query results below:

In the NodeStatus column, values '0' and '1' represents online/offline status, and NodeStatusDescription column describes it (up or down). The column CurrentlyActiveNode provides information which node is active.
From this results, it is possible that a failover event occurred, because AOAP-NODE2 retrieved active role from AOAP-NODE1, which become passive.
Check if availability databases are synchronized (T-SQL)
As every node in WSFC acts like regular SQL Server instance, databases are usually called availability databases. With this T-SQL script, check availability databases on each node which yet failed over yet, for its readiness status:
SELECT database_name,
	is_failover_ready
FROM sys.dm_hadr_database_replica_cluster_states
WHERE replica_id IN (
		SELECT replica_id
		FROM sys.dm_hadr_availability_replica_states
		)

Value ‘0’ means that availability databases are not synchronized, and by knowing that, a potentially unsuccessful automatic failover can be put on hold, as a precaution. On the other hand, value ‘1’ (as shown above) means that availability databases are synchronized on all nodes.
Set the SQL Server Agent alert for failover events
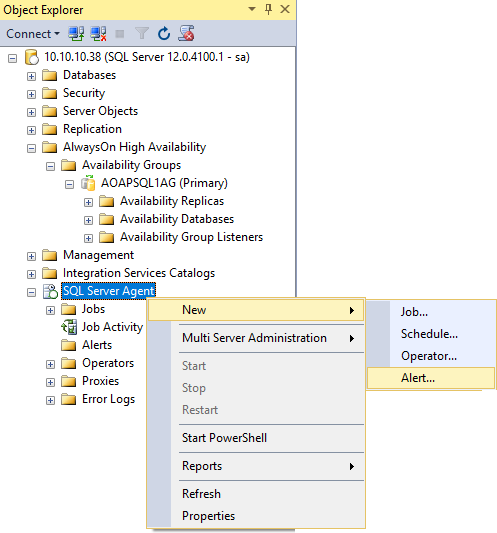
To be notified on failover event, set the alert within SQL Server Agent on a desired FCI:
Input the required information like shown on picture:
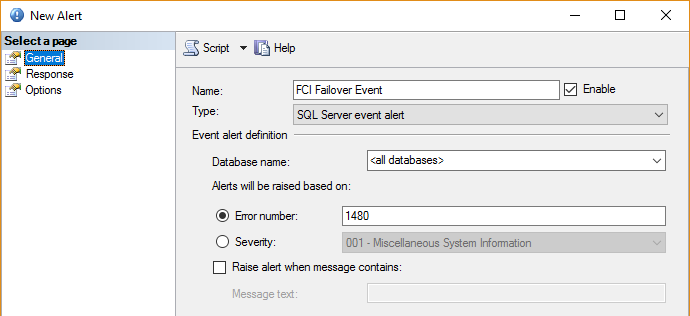
The error number 1480 (aka Database Replica Role Change), referenced above, represents information that the FCI database failed to change to its expected role during the failover process., or in other words, the failover didn’t succeed, because of unavailability of the particular database.
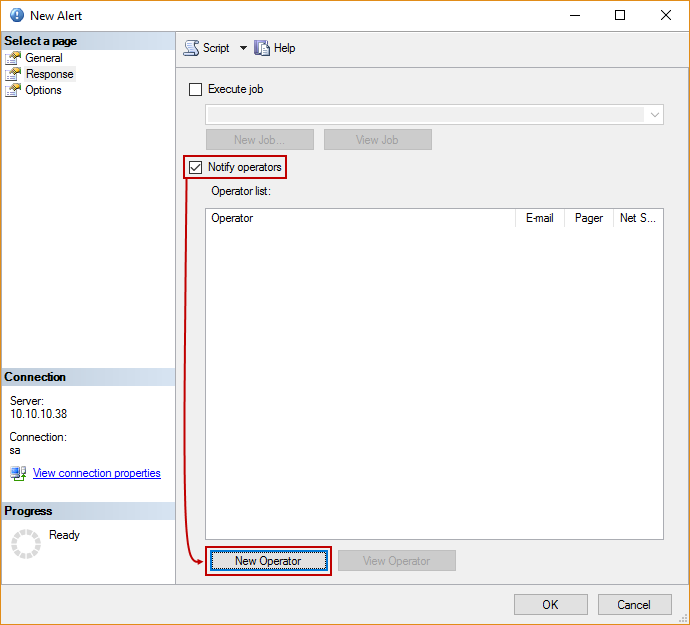
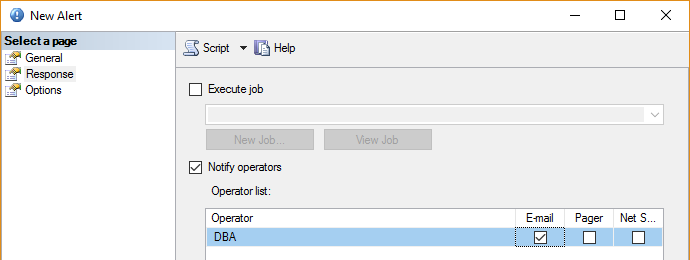
The next step is to define the operator and set the email address for alerting purposes, in the Response tab:
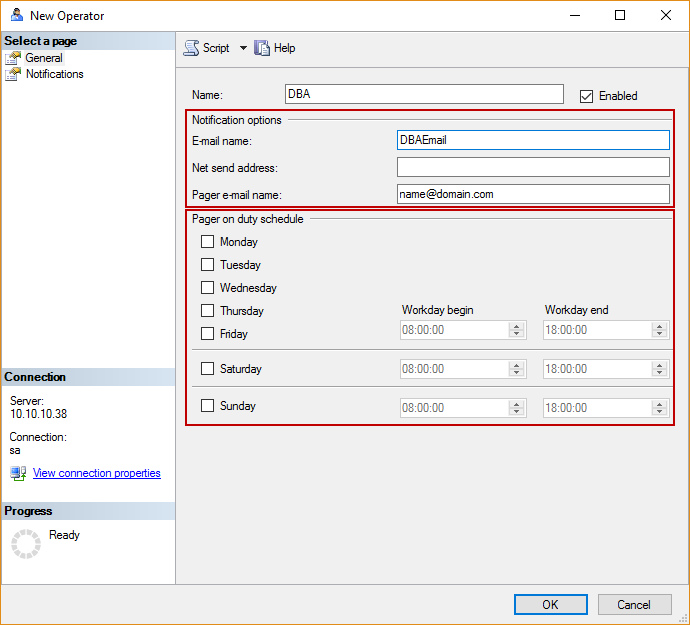
Set a valid email address to send notifications on failover events, and optionally schedule the working hours when this email should arrive:
Be sure to check the Email option, to confirm the alert:
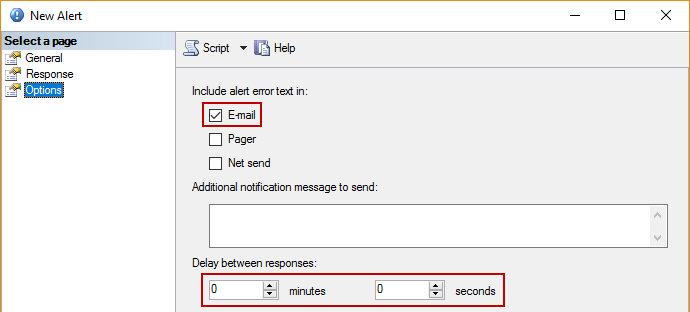
In the Options tab, check the option for including alert error text in email and delay time range:
Monitor SQL Server failover events with ApexSQL Monitor
Besides standard SQL server instances, ApexSQL Monitor fully supports FCI and, specifically, failover event monitoring and alerting, with ease of use.
Get basic information from the ApexSQL Monitor Dashboard
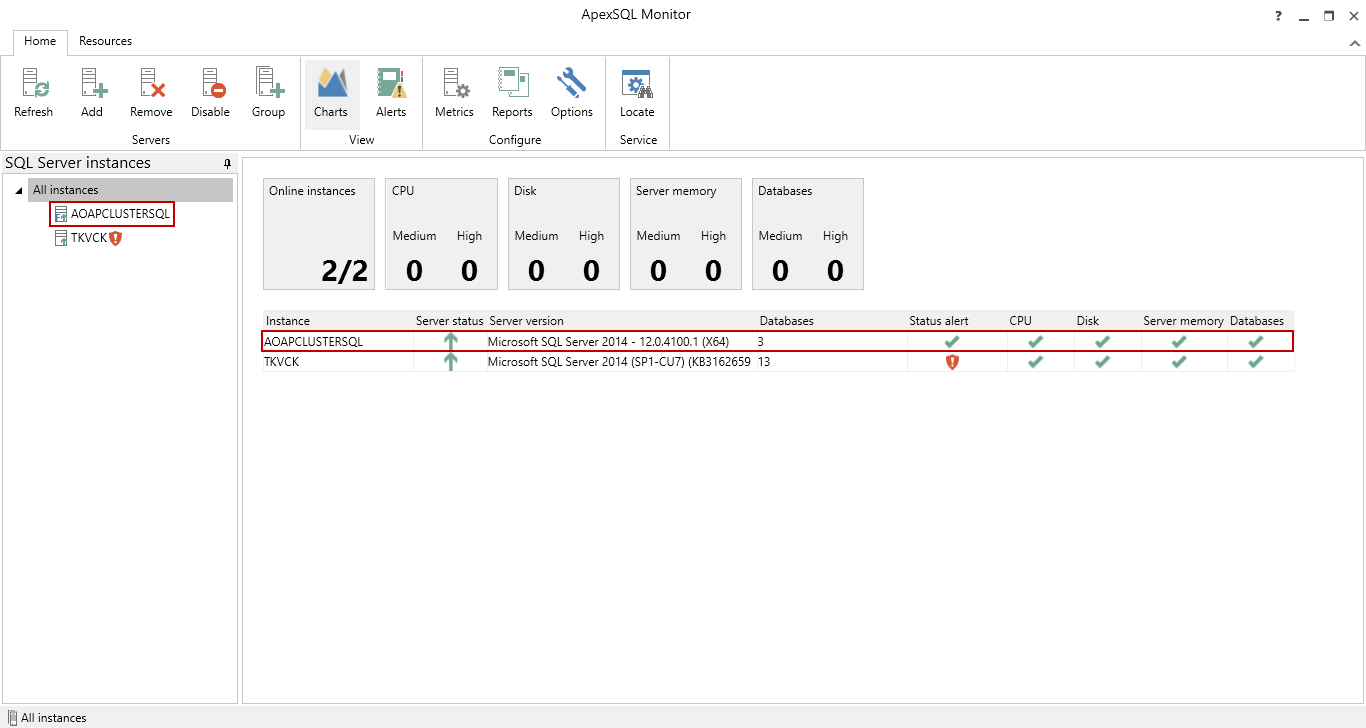
Along with other SQL server instances present in the left pane, FCI servers are distinguished by an ‘F’ on the icon:
When the All instances Dashboard view is chosen, it shows only basic information about clustered instances.
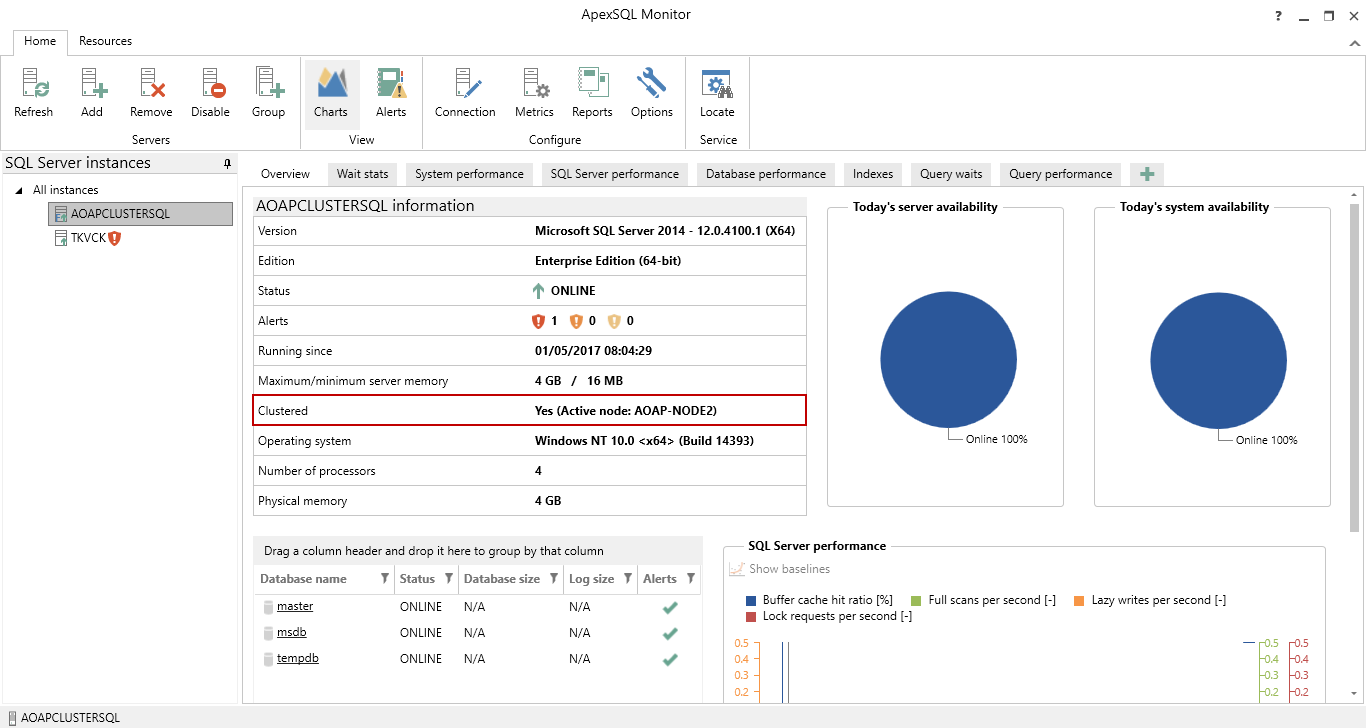
When a particular FCI is selected from the left pane, the Dashboard displays information that the instance is clustered (marked in picture below) and also, which FCI node is active in that particular moment (in this case, the secondary node AOAP-NODE2 is active):
Other information displayed is the same as for regular SQL server (like server version, server status, running time etc.).
Failover performance counter in Metrics view
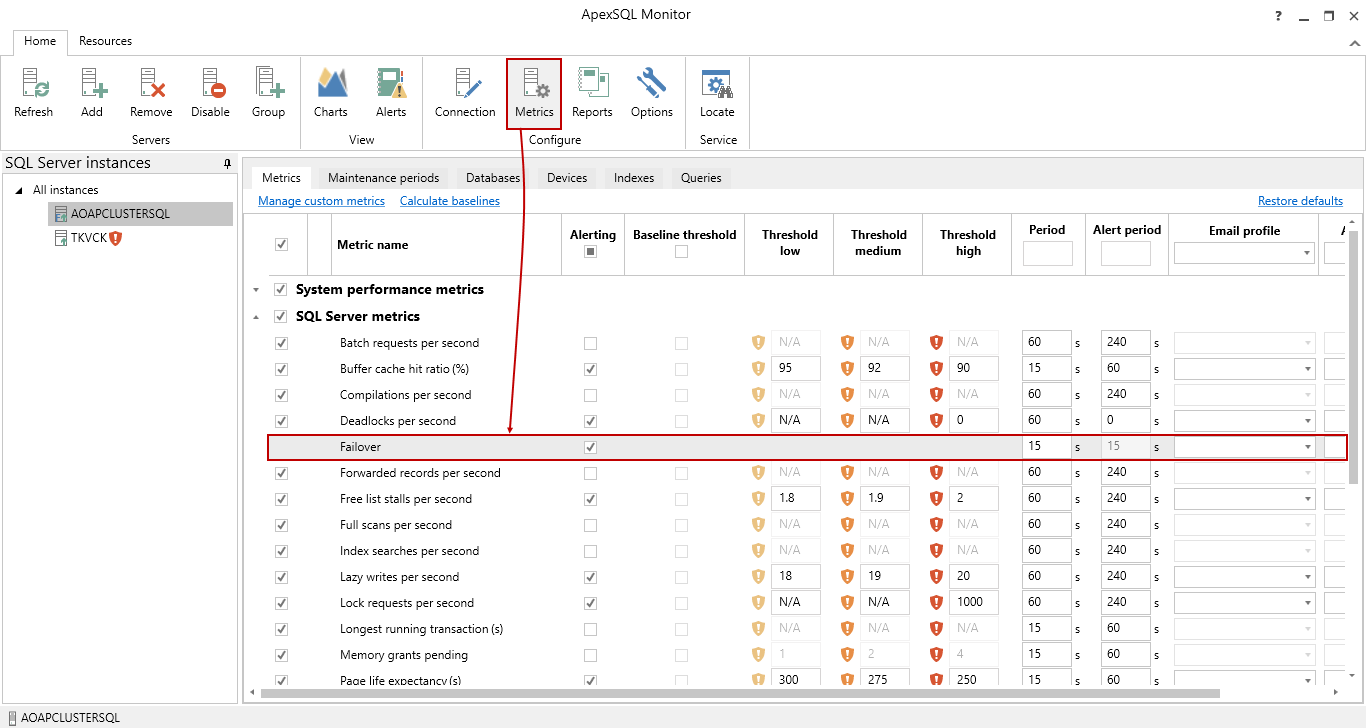
Placed in the SQL Server metrics group, Failover monitoring is implemented as a special performance counter in ApexSQL Monitor:
Additional information on availability databases synchronization status can be reviewed in Databases tab within Metrics view:
Failover event alerting in ApexSQL Monitor
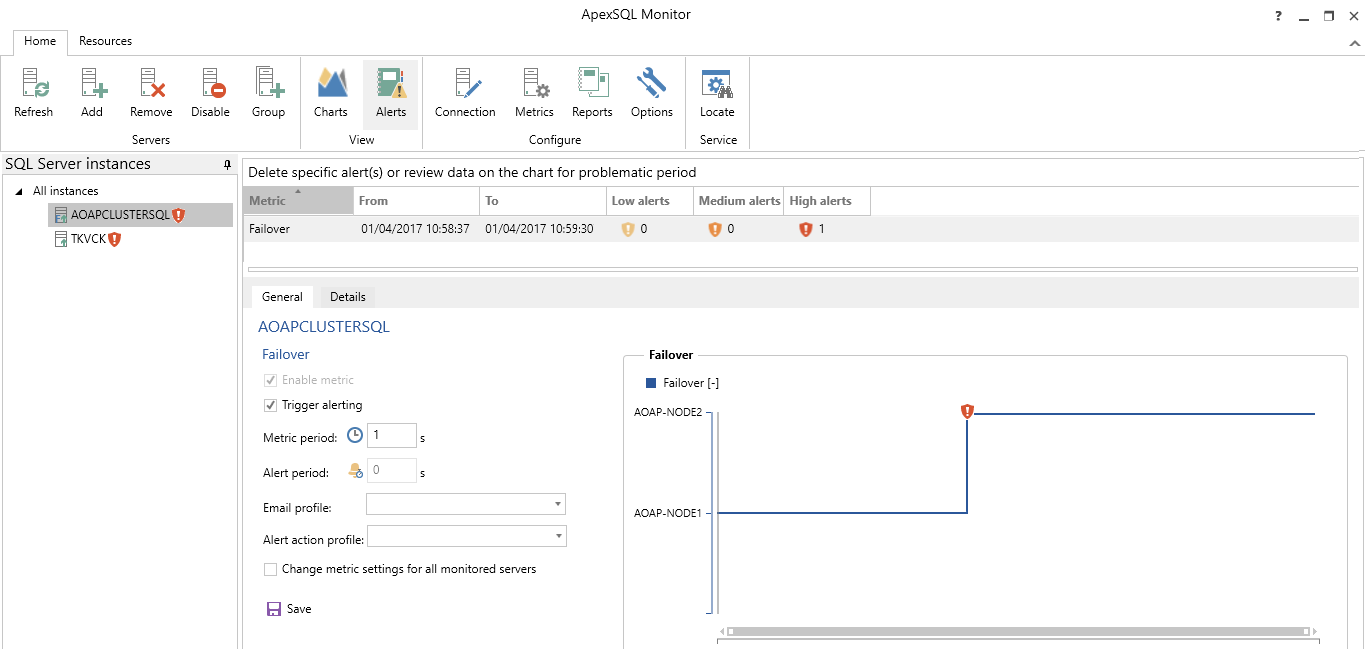
To determine when the failover event(s) occurred, review and resolve alerts related to the mentioned counter:
States of the alert related to the Failover counter resembles the structure of the monitored FCI, and on which node the failover occurred. These two states (in this case) are nodes, active (AOAP-NODE1) and passive (AOAP-NODE2). The image above shows the actual moment of the failover from active to the passive node.
Additionally, failover-related alerts can be automated by creating and managing email notifications.

