サポートと今すぐチャット
サポートとのチャット

Foglight 5.9.5 - Web Component Tutorial

Using the Web Component Tutorial Tutorial 1: Drag and Drop Tutorial 2: Creating a Dashboard Tutorial 3: Adding a Drilldown Page Tutorial 4: Adding Views Tutorial 5: Using a Grid Tutorial 6: Reports Tutorial 7: Creating a Form Tutorial 8: Renderers Tutorial 9: Adding Questions and Answers Tutorial 10: Sending Messages to Other Users

Defining the Alarms Query

The drilldown page is going to display information about the alarms generated against a selected host, so a query is an obvious choice for getting the required data. However, the data retrieved by the query should be for a specific host, but the host is only chosen at run time as a result of user interaction. The solution is to use a parameterized query. The parameter value is assigned at run-time by selecting a row in the Host Details T3 table.

1
On the navigation panel, choose Dashboards > Configuration > Definitions.
The Add Query dialog box appears.
3
In the Add Query dialog box, on the Create a Blank Query tab, type Alarm in the search box, select the Alarm row, and click OK.
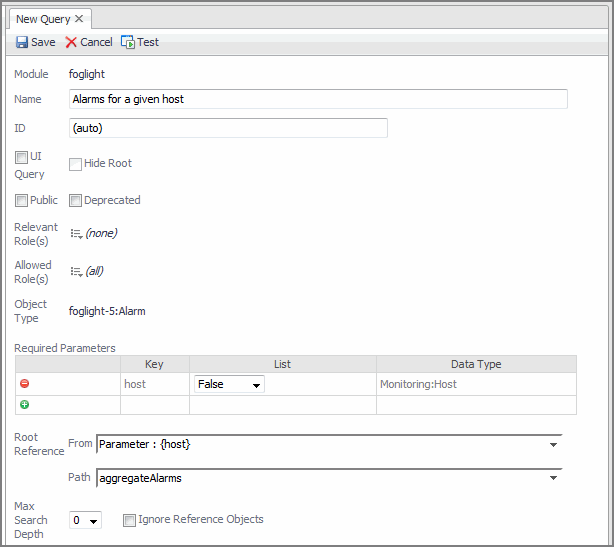
The Definitions pane displays the query editor, which contains all the fields that can be used to construct a query. The required fields are marked by an exclamation point icon on the right side of the field.
Note that a Root Path of {host} is selected. The query requires that a host is passed to it so that it can return only the alarms generated against that host.
4
Test the query by clicking the Test button, appearing at the top of the query definition.
5
In the Input Values dialog box that appears, click the button on the right of the host box, and choose a host.
In the Query Results dialog box that appears, you can see that the query returns a list of objects by expanding any of the any alarms. Some host properties have numerical values, while others, which are themselves objects, do not.
6
Close the Query Results dialog box.
7
Click Save to save the query.

Configuring a Table of Alarms

In this exercise you build a generic table that lists alarms. When the table is actualized, the data in the table will depend on which host was chosen from the parent dashboard. Choosing a particular host in the parent dashboard is the action that triggers the display of the alarm table.

1
On the navigation panel, under Dashboards, choose Configuration > Definitions.
The Add View dialog box appears.
4
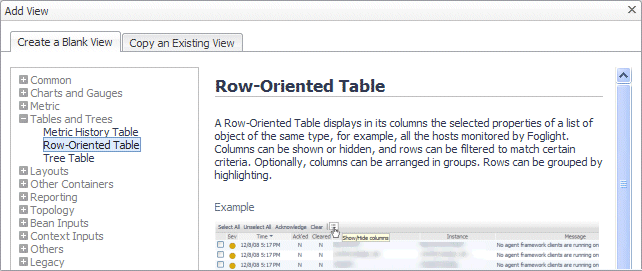
In the Add View dialog box, ensure that the Create a Blank View tab is selected.
5
On the Create a Blank View tab, choose Tables and Trees > Row-Oriented Table.
6
a
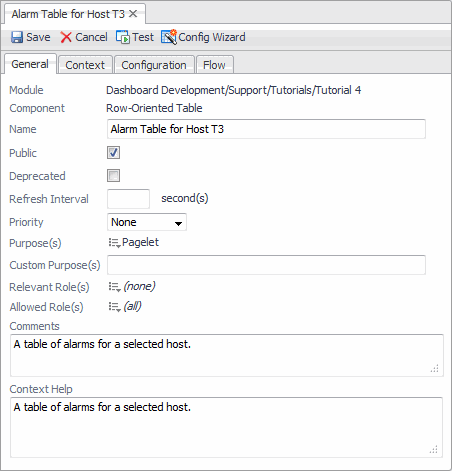
In the Name box, type Alarm Table for Host T3.
b
Leave the Custom Purpose(s), Relevant Role(s), and Allowed Role(s) values unchanged.
For more information about these settings, see the Administration and Configuration Help.
c
On the right of Purpose(s), click Edit. In the dwell that appears, select the Pagelet check box, and click Apply.
d
In the Comments and Context Help boxes, type A table of alarms for a selected host.

The table is not fully configured yet, so if you try and save it now you will get an error that informs you that column values have not been set. The next procedure shows you how to choose columns for the table. When configured, the data in the columns’ cells is dynamically generated, and depends on the host.

Adding columns to the table

To add columns you use the Configuration tab, but before you do, define a Context to tell the component that it will require an object of type Host for its operation.

1
Open the Context tab.
2
Under Inputs, click Add Input and click on the new row.
This configuration causes the context key host to be available to the table. As to the process described in Tutorial 3, you need to configure the Host Details T3 page to pass Host values to the table.
1
Open the Configuration tab.
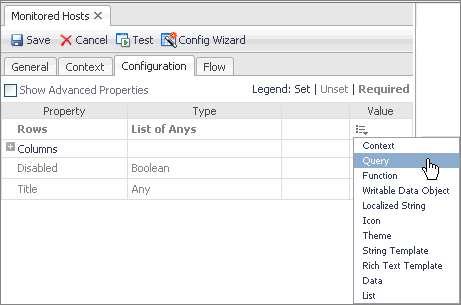
On the Configuration tab, in the Rows row, in the Value column, click Edit and choose Query from the list that appears.
The Edit - Rows dialog box appears.
3
In the Edit - Rows dialog box, click the Query box and choose My Queries > Alarms for a given host.
4
In the table, in the Parameter {host} : of type Monitoring:Host row, in the Value column, click Edit , and in the list that appears, choose Context.
5
In the Edit - Parameter dialog box that appears, click the Input Key box, and choose host (Host) from the list that appears.
6
Leave the other values unchanged, and click Set to close the Edit - Parameter dialog box. In the Edit - Rows dialog box, click Set to close it and return to the Configuration tab.
7
On the Configuration tab, expand the Columns node.
A sub-node called Column appears.
8
Expand the Column node.
A sub-node called Value appears.
9
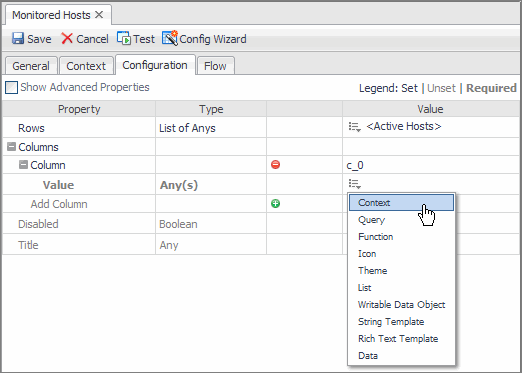
In the row containing the Value node, in the Value column, click Edit , and choose Context from the list that appears.
The Edit - Value dialog box appears.
10
In the Edit - Value dialog box, click the Input Key box, and choose currentRow (Alarm) from the list that appears.
11
Click the Path box and choose Severity - Alarm Severity from the list that appears.
12
In the Edit - Value dialog box, click Save.
1
On the Configuration tab, ensure that the Columns node is expanded, and click to add another column to the table.
Another Column node appears, along with its Value sub-node.
2
In the second column’s Value row, in the Value column, click Edit , and choose Context from the list that appears.
The Edit - Value dialog box appears.
3
In the Edit - Value dialog box, click the Input Key box, and choose currentRow (Alarm) from the list that appears.
4
Click the Path box and choose Message - String from the list that appears.
5
In the Edit - Value dialog box, click Save.

We illustrate another use of parameters by giving the table a title that contains the name of the host.

1
On the Configuration tab, in the Title row, click Edit , and choose Set to Binding > String Template from the list that appears.
The Edit - Title dialog box appears.
2
In the Edit - Title dialog box, in the Value box, type Alarms Table for {0}.
The {0} construct designates a positional parameter. When you use this construct, a row appears in the table below that allows you to associate this parameter with a binding.
3
In the Parameter {0} row, in the Value column, click Edit , and choose Context from the list that appears.
The Edit - Parameter {0} dialog box appears.
4
In the Edit - Parameter {0} dialog box, click the Input Key box, and choose host (Host) from the list that appears.
5
Click the Path box, and choose Name - String from the list that appears.
6
Click Set to close the Edit - Parameter {0} dialog box.
7
Click Set to close the Edit - Title dialog box.

Configuring a Chart Component

Charts can have a large number of properties, but we begin by constructing a simple chart and introduce a more complex example in a later tutorial. For an introduction to Foglight charts, see the Foglight User Help.

1
On the navigation panel, under Dashboards, choose Configuration > Definitions.
The Add View dialog box appears.
4
In the Add View dialog box, on the Create a Blank View tab, choose Charts and Gauges > Time Plot Chart.
5
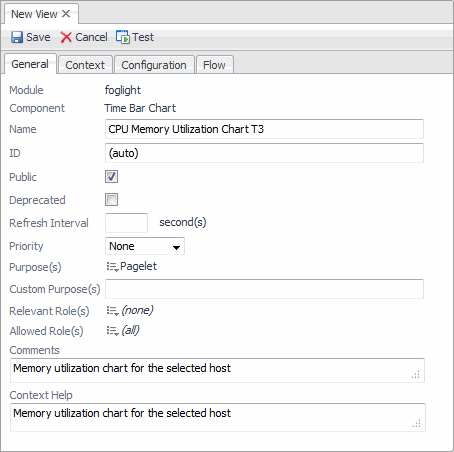
In the Definitions pane, on the General tab, populate the settings using the following values.
Figure 7. Chart settings
Follow the first procedure in Adding columns to the table to make a Host object a required input.
1
Open the Configuration tab.
2
Expand the Metric Data - Single Parent node.
3
In the Metric Parent row, in the Value column, click Edit , and choose Context from the list that appears.
The Edit - Metric Parent dialog box appears.
4
In the Edit - Metric Parent dialog box, click the Input Key box, and choose host (Host) from the list that appears.
5
Click Set in the Edit - Metric Parent dialog box to close it.
6
On the Configuration tab, under the Metric Data - Single Parent node, expand its Single Metric Bindings sub-node and then its Single Metric Binding sub-node.
7
In the Metric row (a sub-node of Single Metric Binding), in the Value column, click Edit , and choose Context from the list that appears.
8
In the Edit - Metric dialog box that appears, click the Input Key box, and choose host (Host) from the list that appears.
9
Click the Path box, and choose Memory - Memory > Utilization - Metric from the list that appears.
10
Click Set to close the Edit - Metric dialog box.
11
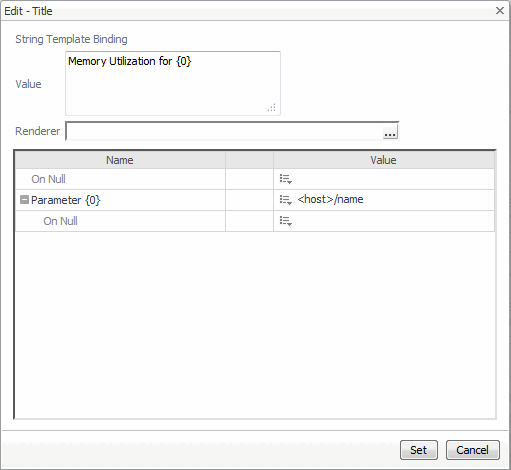
On the Configuration tab, in the Title row, in the Value column, click Edit , and choose Set to Binding > String Template from the list that appears.
12
In the Edit - Title dialog box that appears, in the Value box, type Memory Utilization for {0}.
13
In the table below, in the Parameter {0} row that appears, in the Value column, click Edit , and choose Context from the list that appears.
14
In the Edit - Parameter {0} dialog box that appears, click the Input Key box, and choose host (Host) from the list that appears.
15
Click the Path box, and choose Name - String from the list that appears.
16
Click Set in the Edit - Parameter {0} dialog box to close it.
17
Click Set in the Edit - Title dialog box to close it.
18
On the Configuration tab, click save on the toolbar to save your changes to the CPU Memory Utilization Chart T3 view.
関連ドキュメント

The document was helpful.

評価を選択

I easily found the information I needed.

評価を選択