サポートと今すぐチャット
サポートとのチャット

Foglight 5.9.3 - Dashboard Support Guide

About Dashboard Support Tools

Welcome to the Dashboard Support Guide. This guide describes the pages that you can use to evaluate your custom dashboards.

It describes the Tools and Dashboard Support page, explains how to view information about the data model, and shows you how to explore and publish the unit tests defined for module functions and queries. It contains information about exploring type and property definition inconsistencies, shows you how to view help identifiers per module, and explains where to find information on view usage in modules or sub-modules. Finally, it describes the process of viewing the amounts of data persisted to the database per dashboard, explains the concepts of data sources and their validation, and shows you how to review view error messages raised against one or more modules.

The Tools and Dashboard Support page is your starting point when you want to evaluate the dashboards you build for your monitored system. Use it to quickly assess the state of your dashboards and the underlying model, detect potential problems early on, and prevent unexpected behavior in the application.

Getting Started

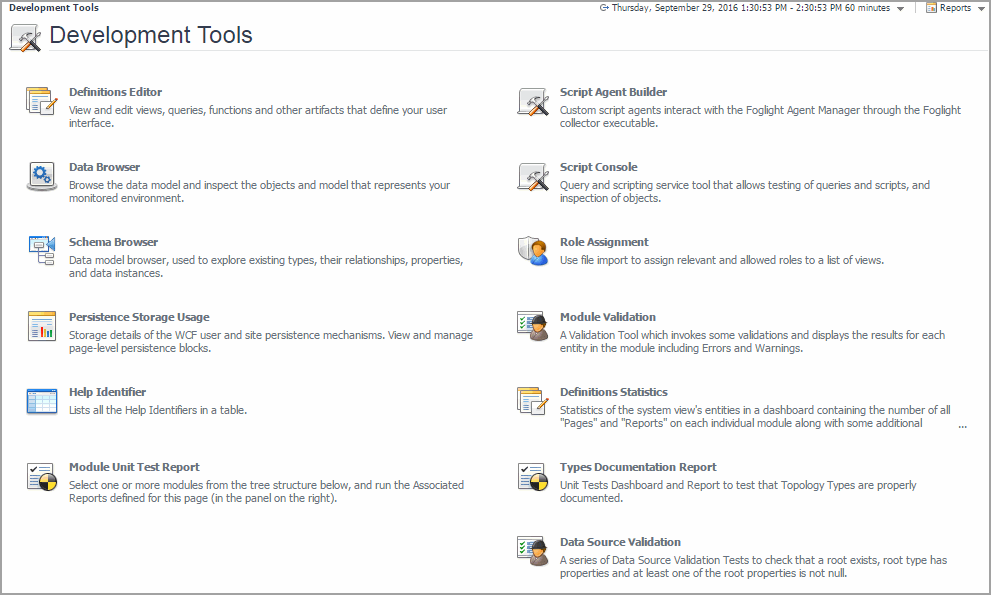
To access this dashboard, on the navigation panel, click Development Tools.

The Development Tools page contains links to dashboards that you can use to verify different aspects of your dashboards during the development cycle. For complete information, see the following :

Exploring the Data Model

Foglight® collects data from the monitored system and uses that data to dynamically build topology models at run-time. A topology model organizes the data in a way that represents the logical and physical relationship between items in your monitored environment and provides the context for the collected metrics.

Topology models consist of nodes, where each node is an instance of a topology object. The nature of the monitored environment dictates the structure and complexity of each topology model and the collection of available topology types. A basic server installation includes a set of core topology types, and each installed cartridge adds to that collection.

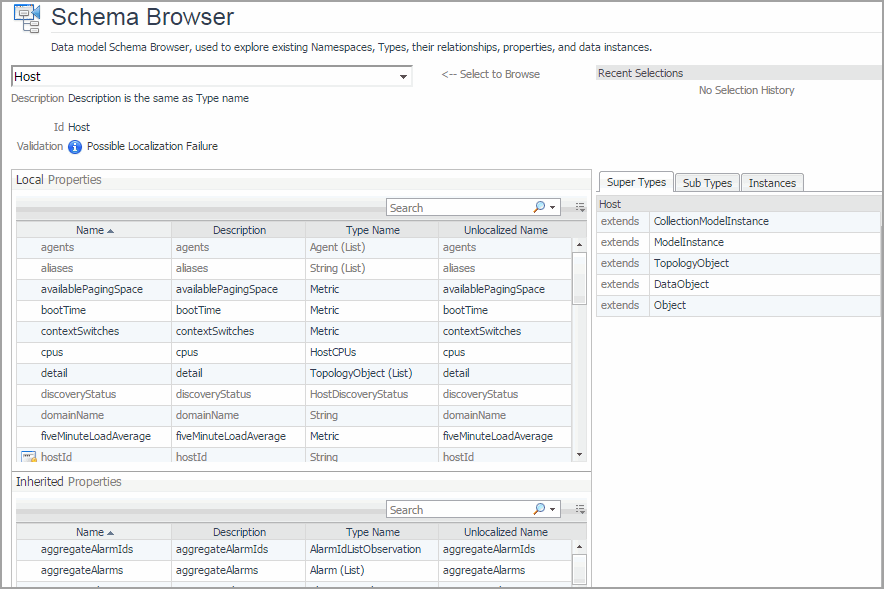
Use the Schema Browser to view information about the available data types, their relationships in the data model, properties, and object instances. This dashboard can help you better understand the data model structure.

Getting Started

To access this dashboard, on the Development Tools page, click Schema Browser.

Figure 1. Schema Browser

セルフ・サービス・ツール
ナレッジベース
通知および警告
製品別サポート
ソフトウェアのダウンロード
技術文書
ユーザーフォーラム
ビデオチュートリアル
RSSフィード
お問い合わせ
ライセンスアシスタンス の取得
Technical Support
すべて表示
関連ドキュメント

The document was helpful.

評価を選択

I easily found the information I needed.

評価を選択