Use the VMware Explorer
The VMware Explorer allows you to monitor a wide range of elements in your virtual infrastructure. It contains a number of informative views through which you can quickly and easily access detailed information about any of the available components (physical or virtual) within the infrastructure. Its hierarchical interface includes drilldown capabilities that display various performance metrics and alarms within the virtual infrastructure.
For reference information about the data appearing on this dashboard, see VMware Explorer Primary view.
The VMware Explorer dashboard contains the following views: the Virtual Infrastructure view and VMware Explorer View.
Virtual Infrastructure view
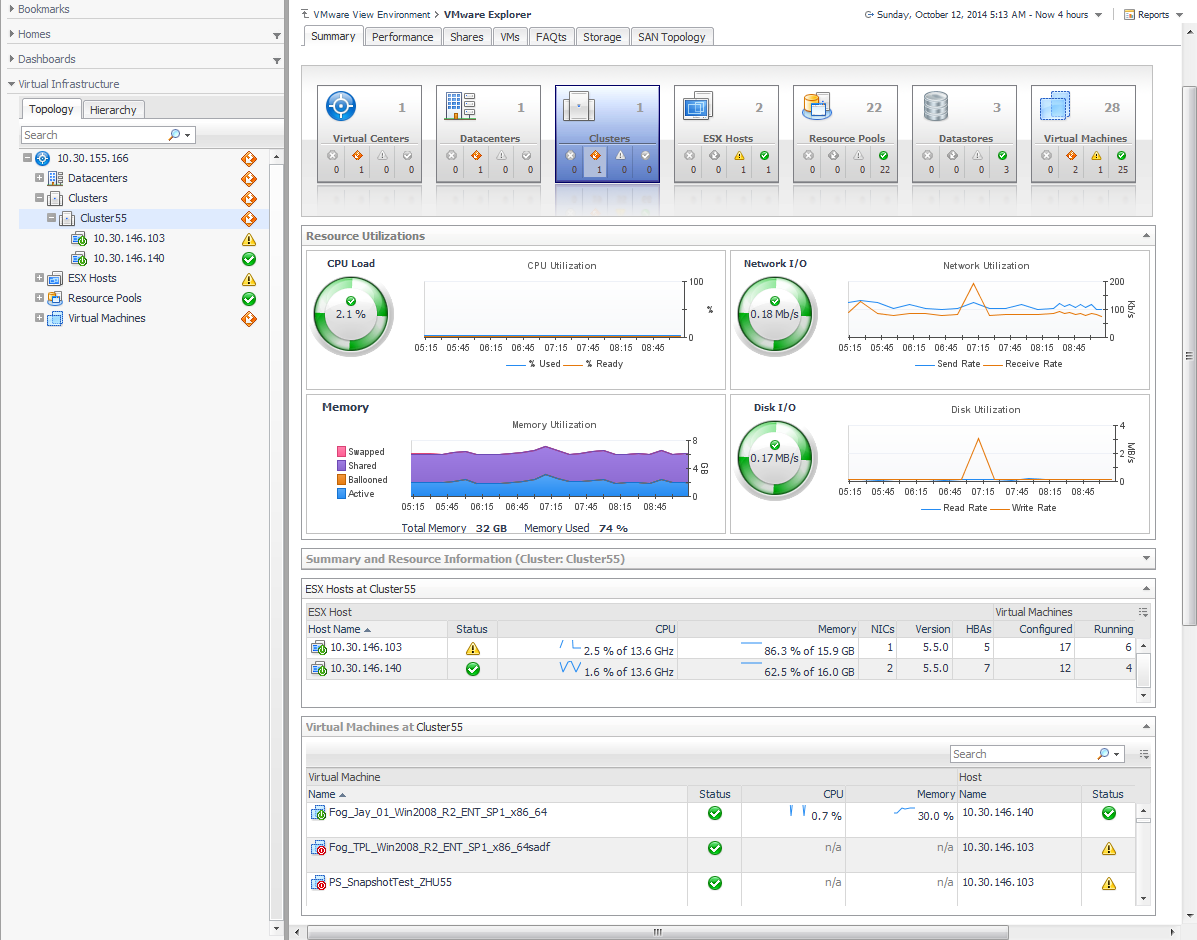
The Virtual Infrastructure view contains a navigation tree on the Topology tab that represents the various virtual infrastructure objects: Virtual Centers, Datacenters, Clusters, ESX® Hosts, Resource Pools, and Virtual Machines. For each individual object or group of objects, a status indicator appears, showing the alarm of highest severity that is outstanding for the that object or objects.
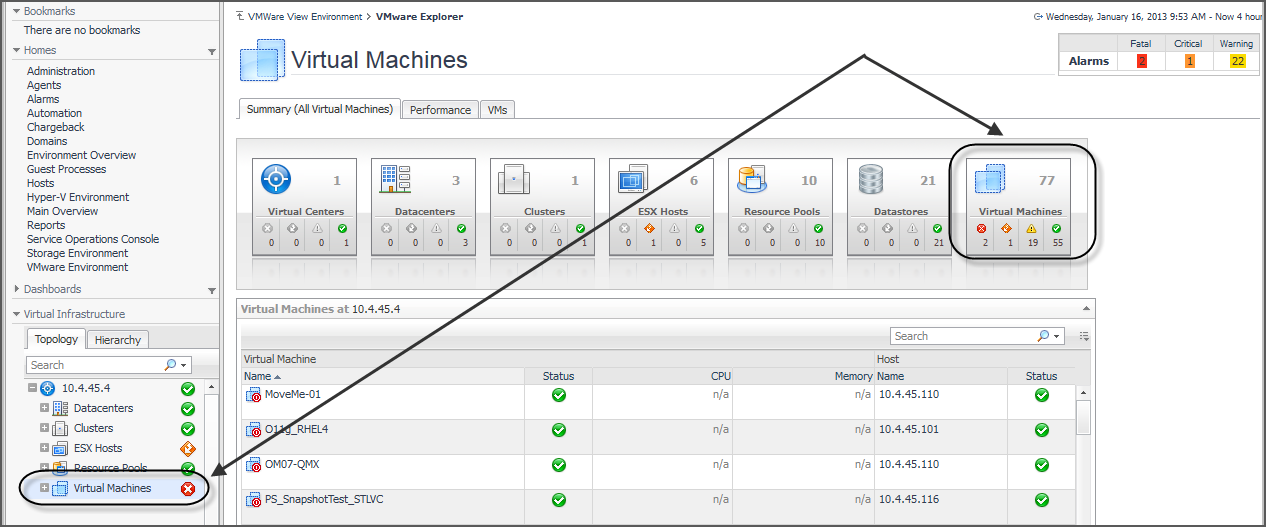
For example, there are 77 virtual machines configured for a VirtualCenter. Fifty-five of the virtual machines have a Normal status, nineteen have a Warning status, one has a Critical status, and another one has a Fatal status. In the Topology view, the virtual machines container for that VirtualCenter displays a Fatal status indicator to show that at least one of the virtual machines associated with the VirtualCenter has an outstanding Fatal alarm.
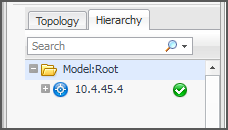
The Hierarchy tab shows the logical layout of VirtualCenter management servers.
Hovering over an object in the Virtual Infrastructure view, you see a popup that provides a summary of the present state of that object.
Selecting an object or group of objects on either tab of the Virtual Infrastructure view displays performance details about your selection in the VMware Explorer. The VMware Explorer takes up the entire display area of the Foglight for Hyper-V browser interface. This view provides significant value to administrators who leverage Foglight for VMware Horizon View to monitor their virtual infrastructure.
VMware Explorer View
A set of tiles displayed along the top indicate the type of the selected object or objects, and the related alarm counts.
Additionally, a collection of navigation tabs appears in this view. These navigation tabs vary from object to object, but generally contain a tab to an object summary (typically the default view), a tab to an object performance overview, and one or more tabs to other relevant information.
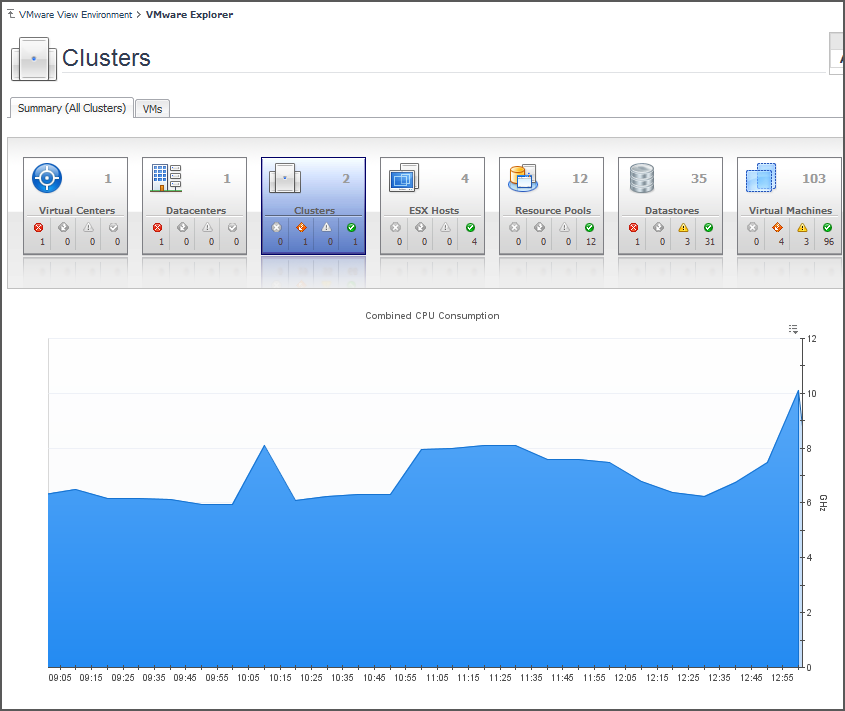
The display area changes in appearance and content, depending on the selected object or group of objects. For example, if you select an object type container from the Topology view, the Summary tab displays a consumption graph and a table that are representative of the group of objects within that container.
However, if you select a Resource Pools container, a Resource Pools Relationship Tree is displayed on the Summary tab. This tree contains every resource pool that belongs to the clusters within the associated VirtualCenter. This is useful if you want to see how those resource pools are laid out, or if you want to take a look at the utilization statistics for each configured resource pool on the VirtualCenter.
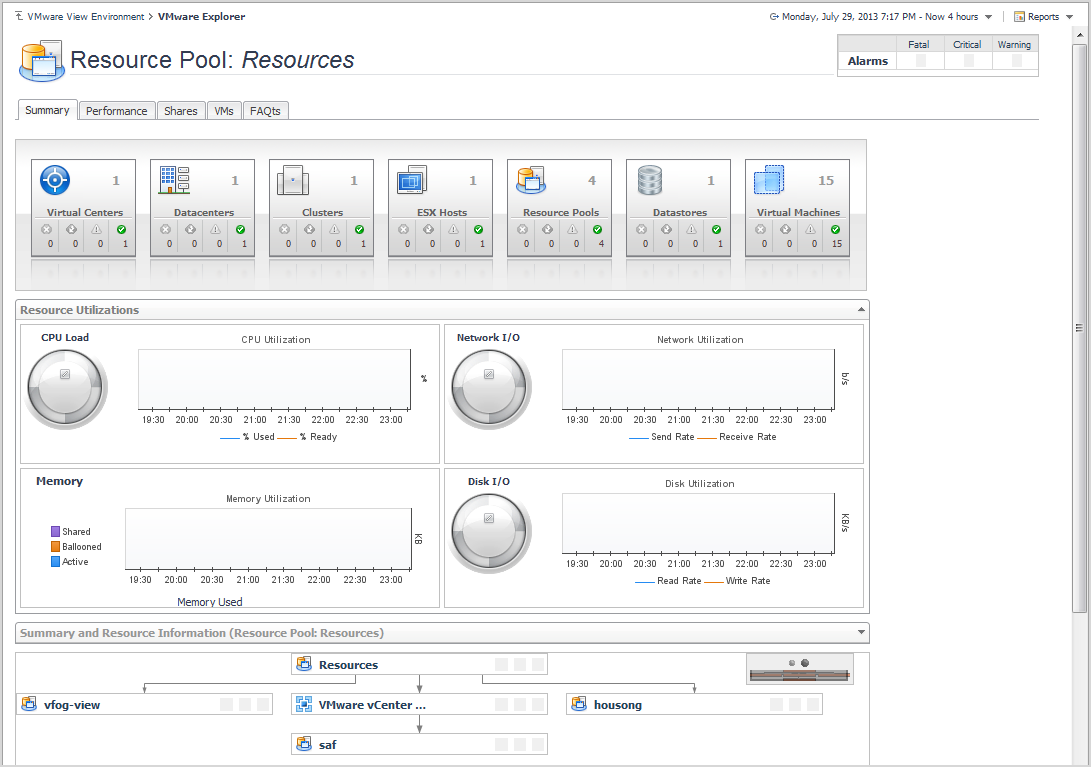
Selecting an individual resource pool displays summary and utilization information for that resource pool. This is typically the type of information you see on the Summary tab when you select any individual object from the Virtual Infrastructure view.
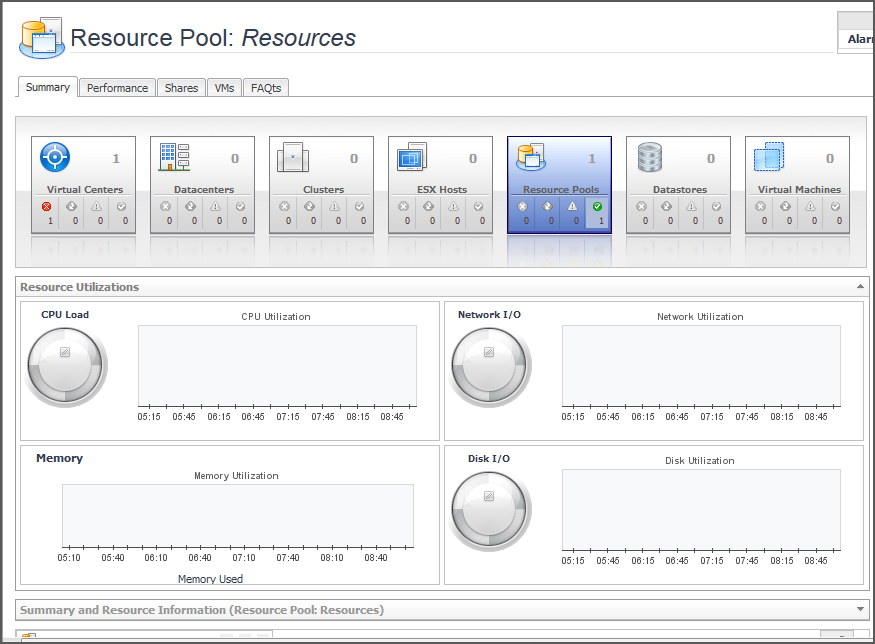
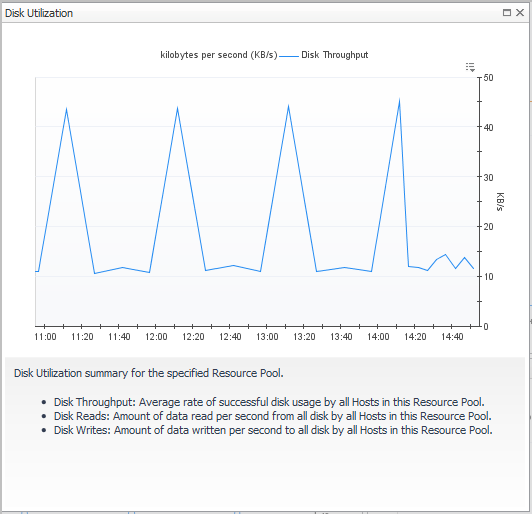
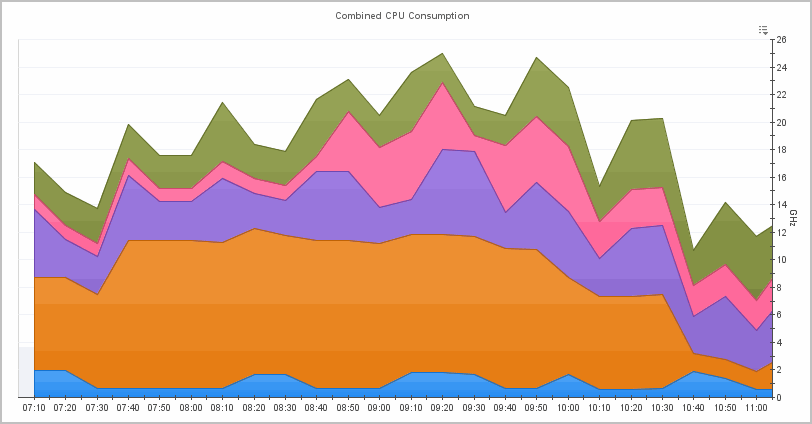
The Utilizations view, typically located across the center of the display area tab, provides numerical and graphical representations of utilization metrics associated with the selected object or group of objects. For example, selecting a single resource pool from the Virtual Infrastructure view and opening the Performance tab in the display area, displays four graphs in the Utilizations view, showing CPU, memory, disk, and network resource utilizations for the selected resource pool.
From there, clicking a graph or a spinner shows a larger view of the graph with descriptive text about each metric appearing in the graph.
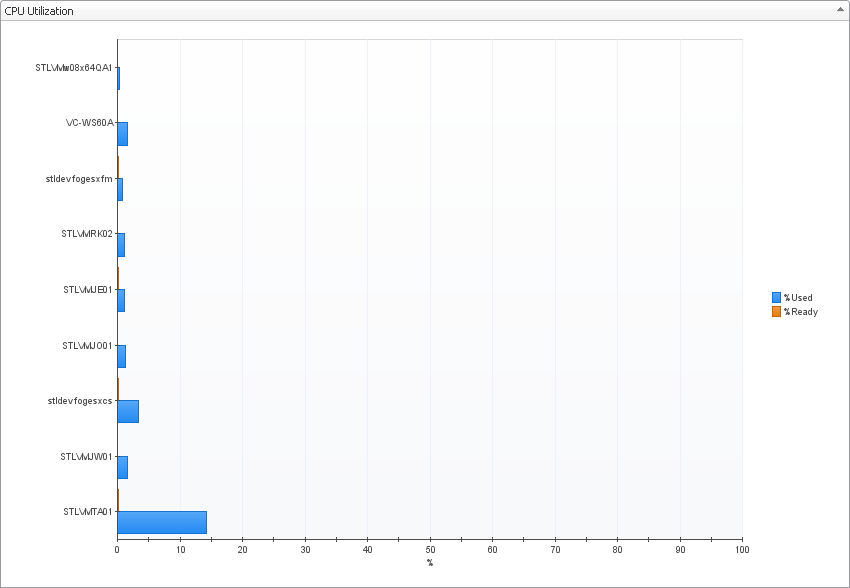
If you open the VMs tab for that same resource pool, the Utilizations view displays one graph illustrating the percent-used and percent-ready CPU utilization for the virtual machines of the resource pool.
If, however, you select a collection of ESX® Hosts from the Virtual Infrastructure view and you open the Summary tab, an informative graph appears in place of a Utilizations view. Selecting a collection of objects in the Virtual Infrastructure view always shows a composite view displaying information about all object instances contained in that collection.
For reference information on this view, see Utilizations views .
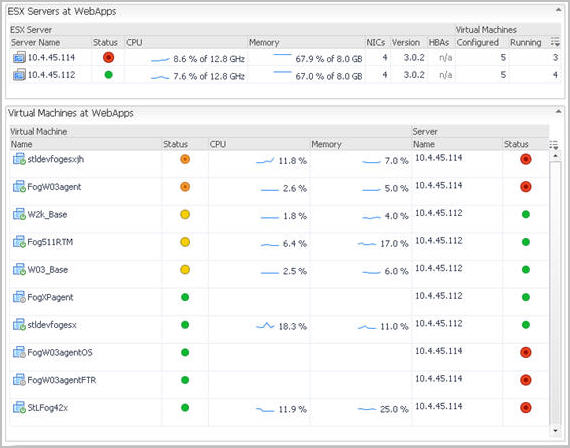
In addition to the Utilizations view, one or more Related Objects views may appear at the bottom of the display area. These views take the form of tables and list either the parent or child objects or both (whichever are applicable) of the object being viewed, and provide pertinent details about each one. Their appearance depends on the type and range of objects selected in the Virtual Infrastructure view.
For example, if you select a single cluster two Related Objects views appear: one displaying the ESX® hosts that belong to their cluster, and another listing the virtual machines running on those hosts. The views also display the performance metrics associated with each list item.
However, when you select a cluster container, the Summary tab shows a Related Objects view that lists all of the clusters in that container and provides pertinent details about each one.

For reference information on this view, see Related Objects views.
The alarm summary in the top-right shows you the number of alarms at each severity level that are outstanding for the selected object. Clicking an alarm count lists the active alarms for the object.
Accessing VMware® actions and tasks
The action panel operates like a drawer. Its default position is closed. To open the action panel, click the arrow at the far right of the Foglight for Hyper-V browser interface.
The action panel provides you with easy access to a number of useful actions and tasks. However, it only provides additional Foglight for VMware Horizon View related actions when you are viewing the VMware Explorer dashboard.
The following image shows an example of a typical VMware Explorer dashboard action panel.

Foglight for VMware Horizon View actions available in the action panel vary depending on the object displayed in the VMware Explorer dashboard.
The following Foglight for VMware Horizon View actions are available from the VMware Explorer dashboard action panel:
Under the Actions heading, the Run Migration Modeler link takes you to the VMware Modeler dashboard, which provides you with a mechanism for viewing the impact that migrating a virtual machine will have on a target ESX® Host.
For more information on the Migration Modeler, see the Managing Virtualized Environments User and Reference Guide.
Under the Actions heading, the View Virtual Infrastructure Alarms link takes you to the VMware Alarms dashboard. For reference information on this dashboard, see Alarms List view.
Under the Actions heading, the View Object IDs link takes you to the Object IDs dialog box. The Object IDs dialog box lists all of the objects in the virtual infrastructure with their type and object ID. The object IDs are the true names of the objects. To produce component-specific thresholds, context is required in the form of the relevant object ID.
To narrow down the list of objects, type a relevant text string in the search field, and click Search. You can type things like a portion of the object type name (for example, server), a portion of the object name (for example, part of the IP address), or a portion of the object ID. To clear the Search box, click Clear.
For more advanced search options, click Advanced. To narrow down the list to objects of a particular type, type the object type name in the Type box. To find the object by name, type the object name in the Name box. To find the object by ID, type the object ID in the Object ID box.
