Agents view
The Agents view appears on the VMware View Environment dashboard. For more information about this dashboard, see Use the VMware View Environment dashboard.
The Agents view displays information on the various agent systems that are collecting and sending details to Foglight for VMware Horizon View. This view can be used to verify that agents are properly reporting information at regular intervals to Foglight for VMware Horizon View.

Each agent in the Agents view contains an alarm summary that shows you the number of alarms of each severity that are presently outstanding for the agent.
Alarms List view
This view is available from the action panel when you click View Virtual Infrastructure Alarms. The VMware Alarms dashboard provides an Alarms List view, which takes up the majority of the dashboard.
Each alarm row in the Alarms List contains an object icon that identifies the source of the alarm, an alarm icon that indicates the severity of the alarm, the time that the alarm occurred, and the text of the alarm. The columns are sortable so that alarms can be listed in order by source, severity, time or message. Simply click a column heading to sort the table by that column.

If you click an alarm’s severity icon, a popup for acknowledging or clearing that alarm is displayed. The popup provides a lot of pertinent information about the alarm, such as the rule of origin for the alarm, the history of the alarm, and all of the notes attached to the alarm. If you click the message or any other column in the row, you are provided with a popup menu. From the popup menu, you can choose to view a VMware Explorer dashboard for the corresponding object.
Cost tab
This tab is available in the VMware Explorer. To find it, open the VMware Explorer and on the Virtual Infrastructure view, that appears on the navigation panel, select a virtual machine instance. In the VMware Explorer, open the Cost tab.
The VMware Explorer’s Cost tab contains information about the costs associated with the selected host’s usage. The information about these costs is provided by the cost models and host assignments that are configured in Foglight Chargeback. For more information about Foglight Chargeback, see the Foglight Chargeback User and Reference Guide.

This view is made up of the following embedded views:
This view shows the levels of Tiered Flat Rate (TFR) and Measured Resource Utilization (MRU), including the base cost and the cost of add-ons, if applicable.
This view lists the existing host add-ons. Add-ons are upgrades to any standard host configuration. These upgrades could include hardware, software, licensing, or infrastructure items such as rack space or power backup units. Add-ons consist of other costs incurred in the IT infrastructure.
This view provides an overview of the measured resource template host assigned to the host. Measured Resource Utilization (MRU) is based on actual percentage utilizations of CPU, Memory, Network, and disk I/O weight. You can create templates based on these levels.
This toolbar contains buttons for initiating wizards that allow you to set up TFR tiers and ESX® host templates, and to edit existing add-ons.
This view provides an overview of the tiered flat rate assignment. A tier is a level of expense for a host machine. Using the Tiered Flat Rates (TFR) you can determine monthly costs of the selected virtual machine.
CPU tab
This tab is available in the VMware Explorer. To find it, open the VMware Explorer and on the Virtual Infrastructure view, that appears on the navigation panel, select an ESX® host instance. In the VMware Explorer, open the CPU tab.
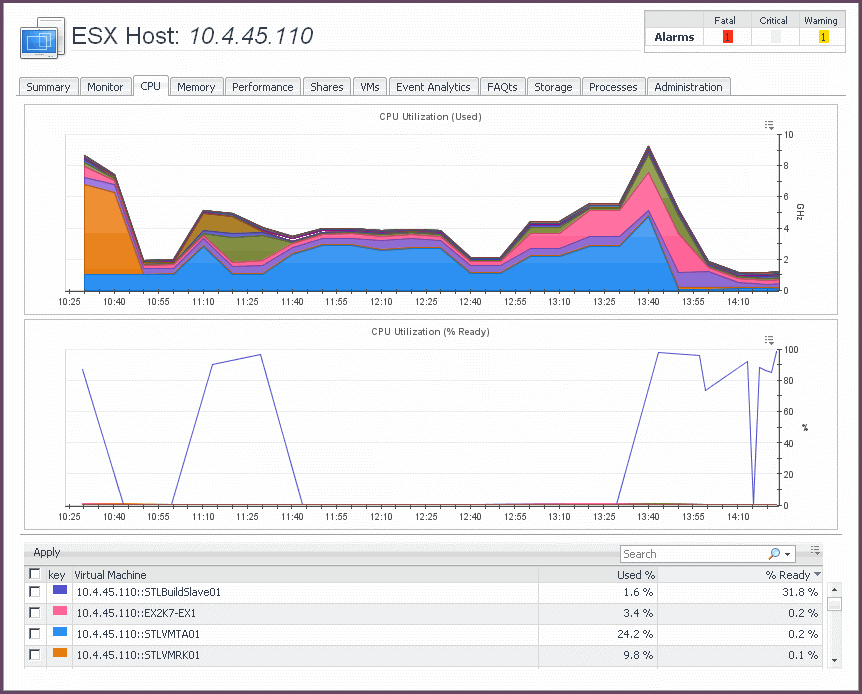
The VMware Explorer’s CPU tab displays the combined CPU utilization for an ESX host, showing the amount of processing speeds that are used by each virtual machine that is running on that host. This includes the amount of used processing speed, and the percentage of time the CPU resources are ready for use, all during a selected time period.

This view is made up of the following embedded views:
This view shows the amounts of processing speed used by each virtual machine that is running on the selected ESX host during the selected time period.
This view shows the percentage of time the CPU resources are ready for use by each virtual machine that is running on the selected ESX host during the selected time period.
This view shows a list of all virtual machines that are running on the selected ESX host. For each virtual machine, it shows its name, the percentages of CPU resources that are used and ready for use, along with a color indicator for displaying this information in the CPU Utilization (Used) and CPU Utilization (% Ready) views. It also allows you to show or hide the related resource use from these views.