Alarms List view
Each alarm row in the Alarms List contains an object icon that identifies the source of the alarm, an alarm icon that indicates the severity of the alarm, the time when the alarm occurred, and the text of the alarm. The columns are sortable so that alarms can be listed in order by source, severity, time, or message. Simply click a column heading to sort the table by that column.

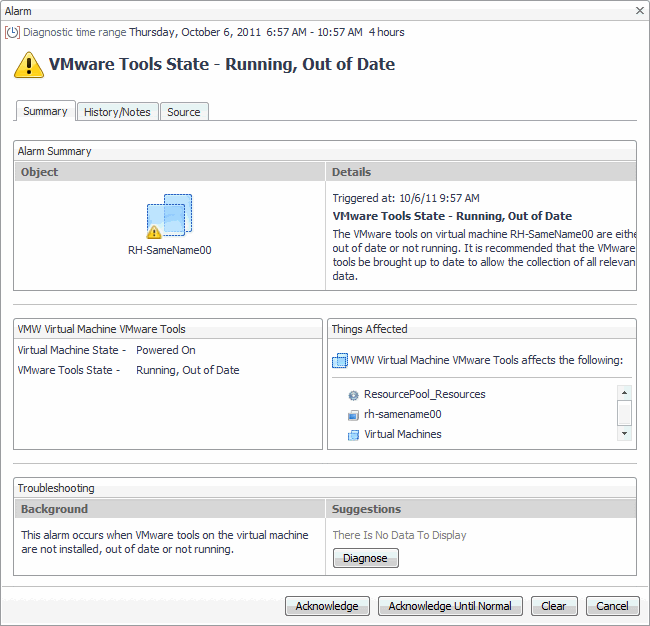
If you click an alarm’s severity icon, a popup for acknowledging or clearing that alarm is displayed. The popup provides a lot of pertinent information about the alarm, such as the rule of origin for the alarm, the history of the alarm, and all of the notes attached to the alarm. If you click the message or any other column in the row, you are provided with a popup menu. From the popup menu, you can choose to view a VMware Explorer dashboard for the corresponding object.
For more information about managing alarms with the Foglight for VMware browser interface, see the Foglight for VMware User Guide.
The Alarms List view takes up the majority of that dashboard.
|
|
|
|
|
|
• |
Object indicator. Indicates if the alarm is related to a virtual center  , datacenter  , cluster  , ESX host  , resource pool  , virtual machine  , datastore  , agent  , or logical drive  . | |
|
|
|
• |
Rule Name. The name of the rule that triggered the alarm. | |
|
|
|
• |
Severity. Indicates the alarm severity: Warning, Critical, or Fatal. | |
|
|
|
• |
Time. The time at which the alarm was generated. | |
|
|
Drill down on: |
|
|
|
• |
Alarm Message, Object indicator, Rule Name, or Time. For server and virtual machine objects, the Select Drilldown dwell appears. |
|
|
|
|
• |
Severity. Displays the Alarm dialog box, showing additional information about the alarm. For more information about alarms in Foglight, see the Foglight User Help. |
|
VMware Explorer views
The VMware Explorer dashboard contains the following views:
Administration tab
The VMware Explorer’s Administration tab provides access to common administrative tasks. It also shows configuration details for a server or a virtual machine (depending on the selected object type), and some high-level information about the object’s resource consumption.
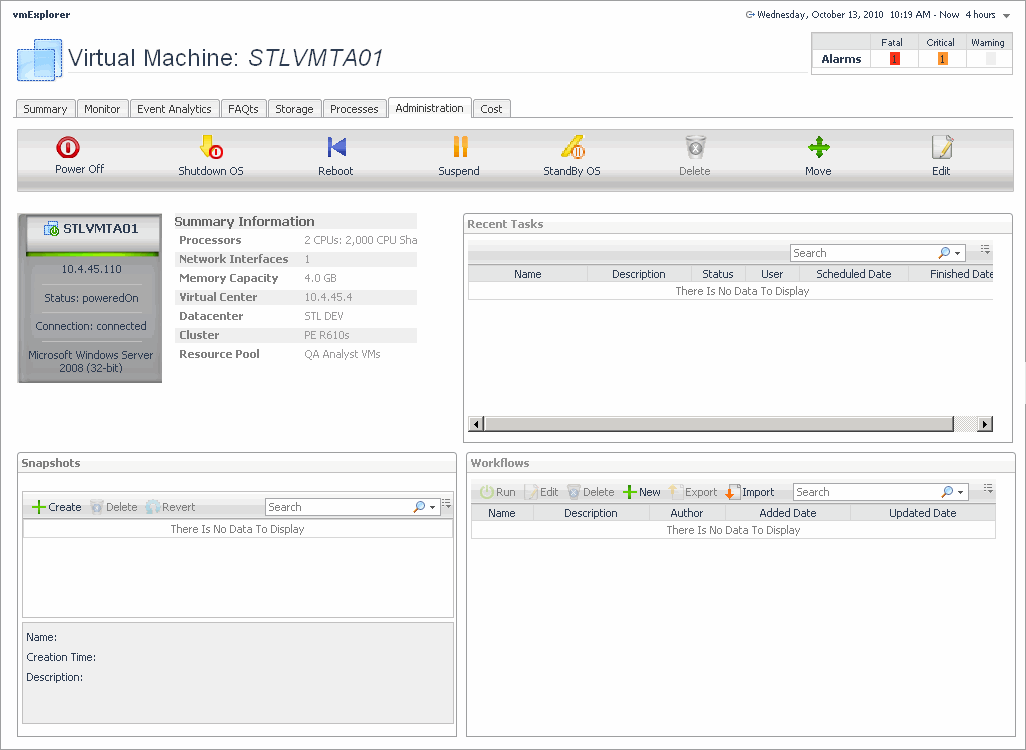
This view is made up of the following embedded views:
Cost tab
The VMware Explorer’s Cost tab contains information about the costs associated with the selected host’s usage. The information about these costs is provided by the cost models and host assignments that are configured in the Foglight for Chargeback. For more information about the Foglight for Chargeback, see the Managing Chargeback User and Reference Guide.

This view is made up of the following embedded views: