CPU tab
The VMware Explorer’s CPU tab displays the combined CPU utilization for an ESX host, showing the amount of processing speeds that are used by each virtual machine that is running on that host. This includes the amount of used processing speed, and the percentage of time the CPU resources are ready for use, all during a selected time period.
This view is made up of the following embedded views:
Event Analytics tab
VMware Explorer’s Event Analytics tab contains details about the state of resource-related metrics collected about an ESX host or a virtual machine over a selected time period, and also shows any events that occurred during that time frame.
This view is made up of the following embedded views:
|
|
Shows a chart indicating the values for one or more metrics selected in the Source Object/Metric view.
|
|
|
|
• |
Alarms. If any alarms are generated against the selected ESX host during the selected time period, and are added as an overlay to the chart using the Infrastructure Changes and Alarms view, they also appear in the chart. | |
|
|
|
|
|
|
• |
CPU Metrics, % Used. The percentage of the ESX host’s CPU utilization spent on executing system code and user programs during the selected time period. | |
|
|
|
|
|
|
|
|
|
• |
Infrastructure changes. If any infrastructure changes occur for the selected ESX host during the selected time period, and are added as an overlay to the chart using the Infrastructure Changes and Alarms view, they also appear in the chart. An infrastructure change is any configuration change that affects the properties of the selected ESX host. This includes the ESX host startup, shutdown, pause, changed shares, changes to memory settings, and similar types of changes. | |
|
|
|
|
|
|
• |
Memory Metrics, Balloon Memory. Amount of memory being used by the VMware Memory Control Driver to allow the virtual machine OS to selectively swap memory. | |
|
|
|
|
|
|
|
|
|
|
|
|
|
|
Drill down on: |
|
|
|
• |
Alarm or infrastructure change. Displays additional information about the selected alarm or change. |
|
|
|
Allows you to add events as overlays to the ESX Host Metrics Vs. Related Events or VM Metrics Vs. Related Events view, and correlate the resource consumption to the stability of your environment. |
|
|
|
• |
Alarms. Allows you to add alarms to the chart, and to review any alarms that are generated against the selected server, during the selected time period. | |
|
|
|
• |
Infrastructure changes. Allows you to add infrastructure changes to the chart, and to review any infrastructure changes that occur for the selected server during the selected time period. An infrastructure change is any configuration change that affects the properties of the selected ESX host or virtual machine object. This includes the object’s startup, shutdown, pause, changed shares, changes to memory settings, and similar types of changes. | |
|
|
Drill down on: |
|
|
|
• |
Alarm or infrastructure change. Displays the Event Details dialog box. |
|
|
|
Shows a chart indicating the utilization percentage for one or more metric values selected in the Source Object/Metric view. If any infrastructure changes occur for the selected server during the selected time period, you can add them as an overlay to the chart using the Infrastructure Changes and Alarms view. This can give you a good idea on how the current resource consumption affects your environment as a whole. For example, a steady increase in memory consumption can trigger memory utilization alarms, which typically indicates that you need to allocate more memory to the affected virtual machine.
|
|
|
|
• |
Alarms. If any alarms are generated against the selected virtual machine during the selected time period, and are added as an overlay to the chart using the Infrastructure Changes and Alarms view, they also appear in the chart. | |
|
|
|
• |
CPU Metrics, % Used. The percentage of the virtual machine’s CPU utilization spent on executing system code and user programs during the selected time period. | |
|
|
|
• |
Disk Metrics, Read Rate. The rate at which the virtual machine reads data from disk during the selected time period. | |
|
|
|
|
|
|
• |
Infrastructure changes. If any infrastructure changes occur for the selected virtual machine during the selected time period, and are added as an overlay to the chart using the Infrastructure Changes and Alarms view, they also appear in the chart. An infrastructure change is any configuration change that affects the properties of the selected virtual machine. This includes the virtual machine startup, shutdown, pause, changed shares, changes to memory settings, and similar types of changes. | |
|
|
|
|
|
|
• |
Memory Metrics, Balloon Memory. Amount of memory being used by the VMware Memory Control Driver to allow the virtual machine OS to selectively swap memory. | |
|
|
|
|
|
|
|
|
|
|
|
|
|
|
Drill down on: |
|
|
|
• |
Alarm or infrastructure change. Displays the Event Details dialog box. |
|
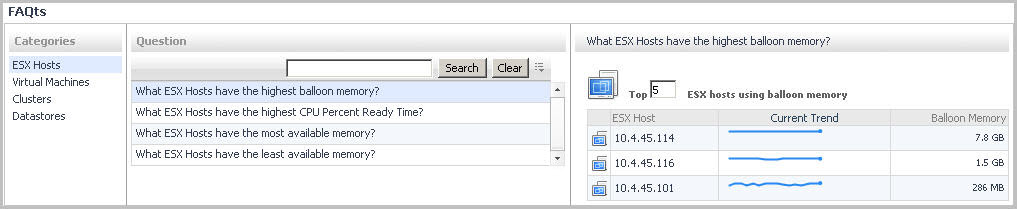
FAQts tab
Through three embedded views (the Categories, Question, and Answer views), the FAQts tab enables you to ask Foglight for VMware questions and provides the answers to those questions.
The FAQts view appears on both the Virtual Environment Summary and VMware Explorer dashboards as a navigation tab.
The FAQts view is made up of the following embedded views:
This view provides an answer to the question selected in the Questions view. The answer appears in the following form:
Top x <objects of category>…
where x is the number of objects of the category you provided in the Categories view.
Specify x by entering a number. The answer is relative to the subset of the infrastructure you are viewing in the dashboard. For example, the top 5 datastores are different for each individual cluster in the infrastructure.
This view lists the categories for which questions can be answered for you by Foglight for VMware.
Click a category in the list to select it.
This view lists the questions, for the category selected in the Categories, that can be answered for you by Foglight for VMware.
Click a question in the list to select it.
If the list of questions is long and you want to narrow it down, search for a particular text string using the Search box.
Memory tab
The VMware Explorer’s Memory tab displays the combined memory utilization for an ESX host, showing the amount memory used by each virtual machine that is running on that host. This includes the amount of active and shared memory in GB, all during a selected time period.
This view is made up of the following embedded views:
|
|
Shows the list of all virtual machines that are running on the selected ESX host.
By default, the Active Memory and Shared Memory graphs show the information about all virtual machines that exist in your environment. Selecting one or more virtual machines in this view and clicking Apply shows memory information for the selected virtual machines. This can help you quickly compare the statistics for two or more virtual machines, when needed. |
|
|
|
|
|
|
• |
Active: Amount of physical memory that is actively being used. | |
|
|
|
• |
Balloon: Amount of memory being used by the VMware Memory Control Driver to allow the virtual machine OS to selectively swap memory. | |
|
|
|
• |
Consumed: Amount of memory that is consumed by the current processes. | |
|
|
|
• |
Granted: Total amount of memory that is allocated to the virtual machine. | |
|
|
|
• |
Shared: Amount of memory that is freed up on the host due to transparent page sharing. | |
|
|
|
• |
Swapped: Amount of memory that is stored in disk swap space. | |