サポートと今すぐチャット
サポートとのチャット

Foglight 5.9.4 - User Guide

Monitoring Your Domains

In Foglight, domains are monitored components grouped together by a common technology. For example, operating systems are grouped together in the Infrastructure domain and application servers are part of the Custom Applications domain. Domains represent parts of your environment that you are interested in monitoring.

Each technology type is considered a subdomain. For example, each type of operating system in the Infrastructure domain is a subdomain.

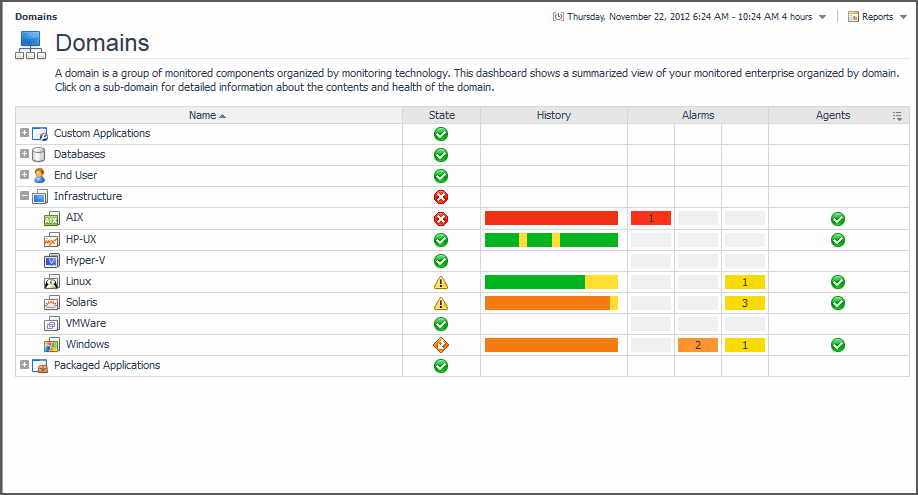
Use the Domains dashboard to monitor your environment if you are a domain Administrator or simply prefer to think of your environment in terms of domain groups. This dashboard allows you to obtain a high-level view of the state of your monitored domains and investigate problems in a particular domain. It also shows you what domains you are not monitoring, but could be.

Viewing detailed information for a domain or subdomain

Drill down on a domain name to view a high-level summary of its monitored components. For example, click Infrastructure to view all monitored virtual and physical hosts in the Hosts dashboard.

By default, the Domains dashboard shows only top-level domains. Expand a domain node to view its subdomains.

Each monitored subdomain comprises the actual instances of that technology type in your environment. Click a subdomain name to drill down to details about it. For example, click Linux to navigate to the list of Linux hosts or click Oracle to drill down to the Oracle Global View.

Investigating Problems in a Domain

Use the Domains dashboard to monitor for problems in your domains — for example, to see if a domain is in a Critical state, or if any alarms have been fired for its components — and take action on them.

By default, a domain or subdomain reflects the current worst state (normal, warning, critical, or fatal) of its components.

Click the State icon to investigate the state of a domain or subdomain that is displaying a warning, critical, or fatal icon.

A popup appears that lists the domain or subdomain’s alarm sources (for example, hosts, application servers, or databases) and their health. These are the components that contributed to the domain or subdomain’s state.

Depending on the problem you are investigating, do one of the following to drill down to more detailed views:

Quest Foglight displays each monitored subdomain’s recent health in the History column. This column summarizes the subdomain’s health for the dashboard’s time range.

The colored segments in the column represent the subdomain’s alarm severity state at different intervals within the time range. Yellow segments represent warning alarms, orange segments represent critical alarms, and red segments represent fatal alarms. Green segments represent intervals without alarms.

The counts in the Alarms column represent the total number of alarms fired for the components in a subdomain; for example, for all monitored virtual hosts in the Infrastructure > VMWare subdomain.

Use this column to view the number and type of alarms fired for these components during the dashboard’s current time range.

Click an alarm to display a popup that contains the standard alarm list. See Viewing, Acknowledging, and Clearing Alarms for more information about working with alarms.

You can view the state of the agents related to a subdomain in the Agents column.

Click a warning, critical, or fatal state icon to display a list of agents with health problems or drill down to the Agents dashboard. For more information, see Investigating Problems with Agents.


Monitoring Your Services

In Quest Foglight, a service is any component or group of components that you want to monitor. If you have the Advanced Operator role, you create services in the Service Builder dashboard that reflects the components in your monitored environment that are meaningful or interesting to your organization.

Examples of services include:

Each service can include any component in your monitored environment, including other services. A service inherently has a service level and relationships of impact and dependency to other services.

For information about how to create a service, see Creating a service.

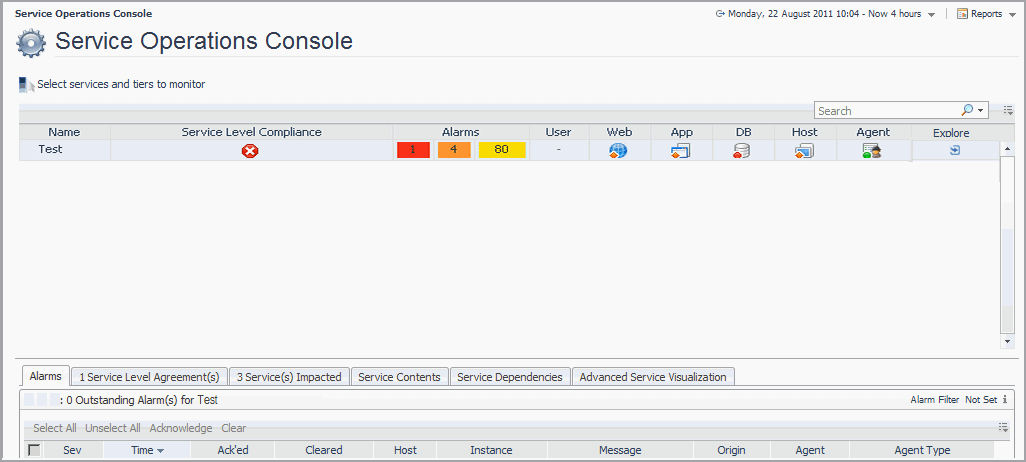
The Service Operations Console dashboard is the best way to monitor a selected set of services. Use it to tailor the way Quest Foglight presents information about monitored components so that it suits your specific needs.

Follow the instructions in this chapter to monitor a specific group of services that interests you by:


関連ドキュメント

The document was helpful.

評価を選択

I easily found the information I needed.

評価を選択