Chatta subito con l'assistenza
Chat con il supporto

Foglight for VMware 5.6.16 - User and Reference Guide

Using Foglight for VMware
Introducing the Virtual Infrastructure Navigation Basics Interacting with Foglight for VMware VMware Performance Agent Configuration
Reference
Views
VMware Alarms Views VMware Explorer Views VMware Modeler Views VMware VirtualCenter Views VMware Environment Views Other Views
Rules
Agent Rules Cluster Rules Datacenter Rules Datastore Rules Resource Pool Rules ESX Server Rules VirtualCenter Rules Virtual Machine Rules VMW Stale Data Management Rule Virtual Switch Rules
Appendix: Alarm Messages

Performance tab

Figure 173. Performance tab
2
On the Virtual Infrastructure view, that appears on the navigation panel, select a Virtual Center, datacenter, cluster, ESX host, resource pool, or one of the following containers: Datacenters, ESX Hosts, Resource Pools, or Virtual Machines.
Table 47. CPU Utilization
Ready. The percentage of time the CPU is ready but is not used.
Used. The percentage of available CPU processing that is currently in use.
Drill down on the CPU Utilization graph. Displays the graph along with some additional information.
Figure 174. CPU Utilization graph
Disk Reads. The amount of data read from disk.
Disk Writes. The amount of data written to disk.
Drill down on the Disk Utilization graph. Displays the graph along with some additional information.
Figure 175. Disk Utilization graph
Table 48. Hosts
CPU #. The number of CPUs associated with the host.
CPU %. The current CPU utilization for the selected host.
Disk Commands Issued/Sec. The rate of disk commands issued for the selected host.
Disk Throughput. The disk throughput rate for the selected host.
Host. The host’s IP address.
Mem %. The current memory utilization for the selected host.
Net Mb/Sec. The current rate of network throughput for the selected host.
Network Packets Sent/Sec. The rate of network packets sent to the network.
Network Packets Received/Sec. The rate of network packets received from the network.
Drill down on the Disk Utilization graph. Displays the graph along with some additional information.
Figure 176. Disk Utilization graph
Active. The amount memory that is actively used.
Granted. The amount memory that is allocated to the selected component.
Swapped. The amount memory that is swapped to disk.
Drill down on the CPU Utilization graph. Displays the graph along with some additional information.
Figure 177. CPU Utilization graph
Network Throughput. The average rate of network throughput.
Packets Received. The amount of data received from the network.
Packets Sent. The amount of data sent to the network.
Drill down on the Network Utilization graph. Displays the graph along with some additional information.
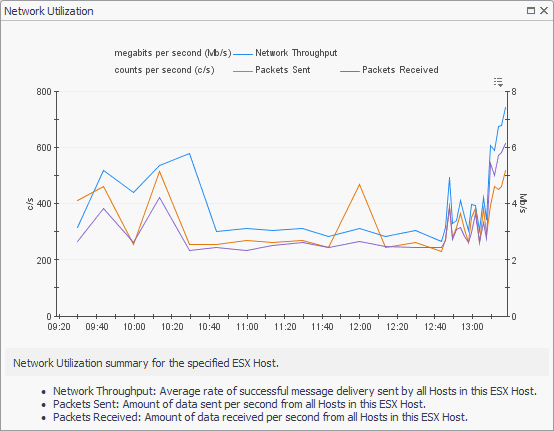
Figure 178. Network Utilization graph

Processes tab

Figure 179. Processes tab
2
On the Virtual Infrastructure view, that appears on the navigation panel, select a Virtual Center, ESX host, or virtual machine instance.

Related Objects views

Resource Pools Relationship Tree view

Related Documents

The document was helpful.

Seleziona valutazione

I easily found the information I needed.

Seleziona valutazione