|
1 |
On the navigation panel, under Dashboards, click Application Servers > Monitor. |
|
2 |
On the Application Servers Monitor dashboard, click the Requests tile. |
|
3 |
|
4 |
In the Traces view, click the name of a single trace. |
|
5 |
|
7 |
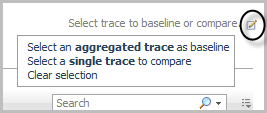
Click the edit icon beside the text Select trace to baseline or compare. |
|
8 |
In the menu that opens, click Select an aggregated trace as a baseline. |
|
9 |
In the Select Trace for Comparison Dialog — Aggregated dialog box, click an aggregated trace to use as a baseline for comparison. |
|
2 |
Click Select a single trace to compare. |
|
3 |
In the Select Trace for Comparison Dialog — Single dialog box, click a single trace to compare. |
|
2 |
Click Clear selection. |
|
1 |
On the navigation panel, under Dashboards, click Application Servers > Administration. |
|
3 |
On the Java Administration dashboard, click the Agent Configuration tab. |
|
5 |
In the menu that opens, select Edit instrumentation settings. |
|
6 |
Click the Object Tracking tab. |
|
7 |
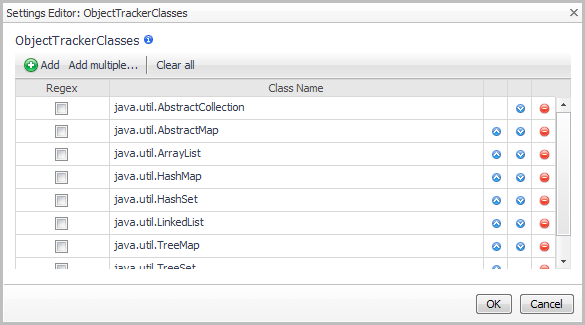
Click the edit icon to the right of ObjectTrackerClasses to update the list of classes being included or excluded. |
|
a |
In the Settings Editor dialog box, click Add. A blank row is added to the bottom of the list. |
|
c |
|
d |
Click Add again. |
|
e |
In the new blank box, type: com.quest.pkg2. |
|
g |
Click OK. The new entries are added to the ObjectTrackerClasses list in the Configuration Category Editor dialog box. |
|
IMPORTANT: These settings are valid when the Instrumentation Level is set to FullDetail or ComponentDetail. Changing their values has no effect if the Instrumentation Level is set to BasicDetail or NoDetail. |
|
8 |
Click Save. |
|
9 |
Optional — Edit the Nexus recording settings to set the maximum amount of time that the agent tracks a live object (that is, the LiveObjectLifespanLimit). By default, the LiveObjectLifespanLimit is set to 900 seconds. |
|
10 |
Optional — Edit the Nexus recording settings to set the maximum number of live objects that the agent tracks. By default, the LiveObjectCountLimit is set to 524288. |
|
1 |
|
2 |
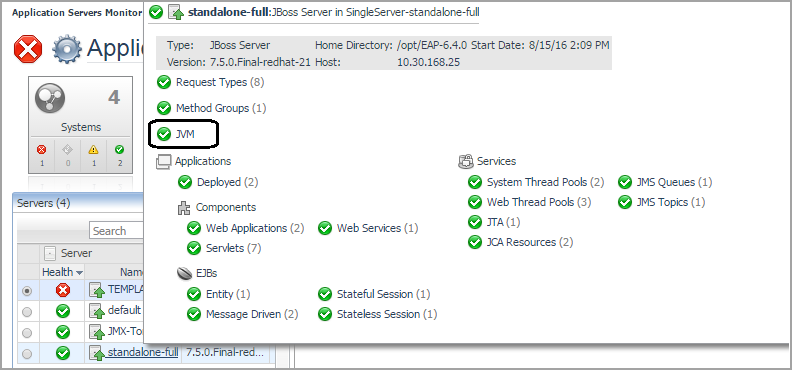
Click the Servers tile and select a server. |
|
3 |
In the server details view, click JVM (not the status icon). |
|
4 |
|
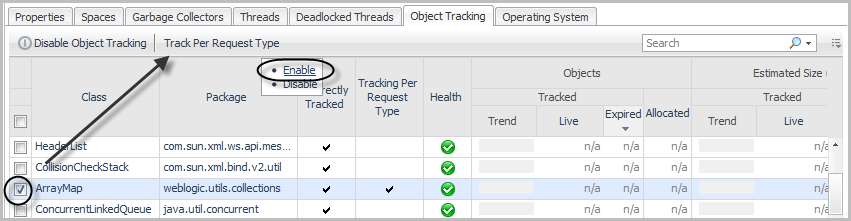
• |
Click Enable Object Tracking. |
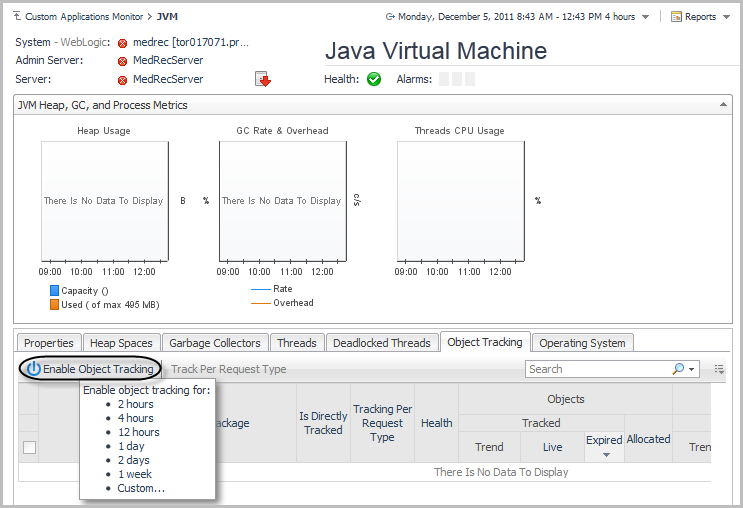
|
• |
Select one or more classes from the list, then click Track Per Request Type. |