Chatta subito con l'assistenza
Chat con il supporto

Foglight for Hyper-V 5.8.2 - User and Reference Guide

About Foglight for Hyper-V Agent administration Performance monitoring with the Hyper-V Environment dashboard Performance investigation with the Hyper-V Explorer Foglight for Hyper-V alarms Appendix: Hyper-V Agent error codes

Hyper-V Explorer Monitor tab

The Hyper-V Explorer Monitor tab shows details of system resources consumption for a server or a virtual machine.

This tab appears in the Hyper-V Explorer when you select a server or a virtual machine on the Hyper-V Explorer Topology tab.
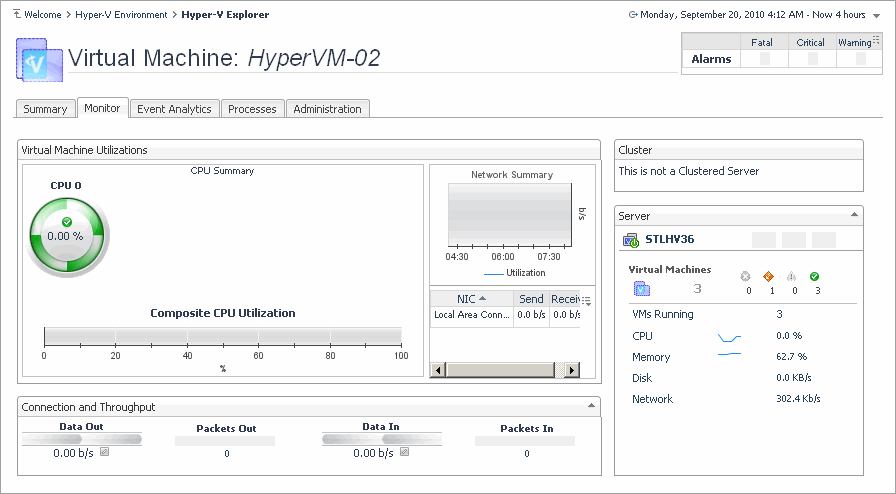
Figure 182. Monitor tab

This tab is made up of the following embedded views:

Table 104. Cluster

Shows the details about the cluster to which the selected server belongs.

Cluster. The name of the server cluster to which the selected server belongs, followed by the total counts of alarms associated with the cluster, broken down by alarm types (Normal, Warning, Critical, Fatal).
Servers. The number of all servers associated with the cluster, including running and turned-off servers.
VMs. The number of all virtual machines that exist on the selected server, including running and powered-off virtual machines.
Drill down on any alarm count. Displays the Alarms dialog box that shows a list of all related alarms.

When exploring virtual machines, this view shows the dynamics of network traffic. For servers, this view also illustrates disk and memory input and output rates.

Memory Swap In. The rate at which memory swap-ins occur.
Memory Swap Out. The rate at which memory swap-outs occur. When memory becomes scarce, the OS swaps out sleeping processes, then swaps out active processes that use large amounts of memory. If swap-outs occur, the swap space can become critically low.
Network Data In. The rate at which data is received from the network during the selected time period.


Network Data Out. The rate at which data is transferred to the network during the selected time period.


Network Packets In. The rate at which network packets are received during the selected time period.
Network Packets Out. The rate at which network packets are sent during the selected time period.
Storage Read Rate. The rate at which data is read from the disk during the selected time period.
Storage Reads. The percentage of elapsed time that the disk is busy servicing read requests during the selected time period.
Storage Write Rate. The rate at which data is written to the disk during the selected time period.
Storage Writes. The percentage of elapsed time that the disk is busy servicing write requests during the selected time period.

Drill down on:

Memory Swap In. Displays the Swap In dialog box.
Figure 183. Swap In dialog box
Memory Swap Out. Displays the Swap Out dialog box.
Figure 184. Swap Out dialog box
Network Data In. Displays the Data In dialog box.
Figure 185. Data In dialog box
Network Data Out. Displays the Data Out dialog box.
Figure 186. Data Out dialog box
Network Packets In. Displays the Network Packets Received dialog box.
Figure 187. Network Packets Received dialog box
Network Packets Out. Displays the Network Packets Sent dialog box.
Figure 188. Network Packets Sent dialog box
Storage Read Rate. Displays the Read Rate dialog box.
Figure 189. Read Rate dialog box
Storage Reads. Displays the Disk Read Requests dialog box.
Figure 190. Disk Read Requests dialog box
Storage Write Rate. Displays the Write Rate dialog box.
Figure 191. Write Rate dialog box
Storage Writes. Displays the Disk Write Requests dialog box.
Figure 192. Disk Write Requests dialog box
Table 106. Server

Shows the current state of the server associated with the selected virtual machine, its current resource consumption, and indicates the number of virtual machines associated with the server.

CPU. The current percentage of the server’s CPU load, used to execute system code and user programs, based on the total CPU capacity.
Disk. The server’s current disk I/O rate.
Memory. The current percentage of the server’s memory usage
Network. The current rate at which the server transfers data from and to the network.
Virtual machines. The number of the virtual machines associated with the server, followed by the counts of all alarms associated with the virtual machines, broken down by the alarm state (Normal, Warning, Critical, Fatal).
VMs Running. The number of the virtual machines associated with the server that are currently running.

Drill down on:

Any alarm count. Displays the Alarms dialog box that shows a list of all related alarms.
Figure 193. Alarms dialog box
CPU. Displays the CPU Utilization dialog box.
Figure 194. CPU Utilization dialog box
Disk. Displays the Disk Reads and Writes dialog box.
Figure 195. Disk Reads and Writes dialog box
Figure 196. Memory. Displays the Memory Utilization dialog box.
Network. Displays the Network Utilization dialog box.
Figure 197. Network Utilization dialog box
Server. Displays the servers details in the Hyper-V Explorer Summary tab.
Virtual Machines. Displays the Virtual Machines dwell, showing the names and states of all virtual machines name associated with the server.
Figure 198. Virtual Machines dwell

Shows the utilization of the selected server’s resources.

Composite CPU Utilization. The combined CPU utilization across all CPUs on the selected server.
CPU 0-N. The current percentage of each individual CPU’s load, used to execute system code and user programs, based on the its total CPU capacity.
Memory Summary, Consumed. The amount of memory that is used over the selected time period.
Memory Utilization. The percentage of the server memory that is currently in use.
Network Summary, NIC. The name of a network interface card.
Network Summary, Receive. The current rate at which a network interface card receives data from the network.
Network Summary, Send. The current rate at which a network interface card transfers data to the network.
Network Summary, Utilization. The current rate at which the server transfers data to and from the network during the selected time period.
Storage Summary, Disk Usage. The rate at which the server reads from or writes data to disk during the selected time period.

Drill down on:

CPU 0-N. Displays the CPU N dialog box.
Figure 199. CPU N dialog box
Composite CPU Utilization. Displays the Composite CPU Utilization dialog box.
Figure 200. Composite CPU Utilization dialog box
Disk Usage. Displays the Storage Summary dialog box.
Figure 201. Storage Summary dialog box
Memory Summary, Consumed. Displays the Memory Consumed dialog box.
Figure 202. Memory Consumed dialog box
Memory Utilization. Displays the Server Memory Utilization dialog box.
Figure 203. Server Memory Utilization dialog box
Network Summary Utilization. Displays the Network Summary dialog box.
Figure 204. Network Summary dialog box
NIC (any entry). Displays the NIC Statistics dialog box.
Figure 205. NIC Statistics dialog box
Table 108. Virtual Machines

Shows a list of virtual machines associated with the selected server.

Running. The number of the virtual machines associated with the server that are currently running.
Virtual Machine. For each virtual machine that is associated with the selected server, and is currently running, there is an entry showing the name of the virtual machine followed by the total counts of alarms associated with the virtual machine, broken down by alarm types (Normal, Warning, Critical, Fatal).
Virtual machines. The number of the virtual machines associated with the server, followed by the counts of all alarms associated with the virtual machines, broken down by the alarm state (Normal, Warning, Critical, Fatal).

Drill down on:

Any alarm count. Displays the Alarms dialog box that shows a list of all related alarms.
Figure 206. Alarms dialog box
Virtual Machine. Displays the virtual machine details in the Hyper-V Explorer Summary tab.
Virtual Machines. Displays the Virtual Machines dwell, showing the names and states of all virtual machines associated with the server.
Figure 207. Virtual Machines dwell

Shows a list of virtual machines associated with the selected server.

Composite CPU Utilization. The combined CPU utilization across all CPUs on the selected virtual machine.
CPU 0-N. The current percentage of each individual CPU’s load, used to execute system code and user programs, based on the its total CPU capacity.
Network Summary, NIC. The name of a network interface card used by the selected virtual machine.
Network Summary, Receive. The current rate at which a network interface card receives data from the network.
Network Summary, Send. The current rate at which a network interface card transfers data to the network.
Network Summary, Utilization. The current rate at which the virtual machine transfers data to and from the network during the selected time period.

Drill down on:

CPU 0-N. Displays the CPU N dialog box.
Figure 208. CPU N dialog box
Composite CPU Utilization. Displays the Composite CPU Utilization dialog box.
Figure 209. Composite CPU Utilization dialog box
Network Summary Utilization. Displays the Network Summary dialog box.
Figure 210. Network Summary dialog box
NIC (any entry). Displays the NIC Statistics dialog box.
Figure 211. NIC Statistics dialog box

Hyper-V Explorer FAQts

This tab only appears when you are exploring individual clusters, servers, and virtual machines. It gives you answers to common questions related to the selected component. For example, when you select a Hyper-V server and open this tab you can quickly find out which servers in the cluster are consuming the least network bandwidth or have the most available memory.
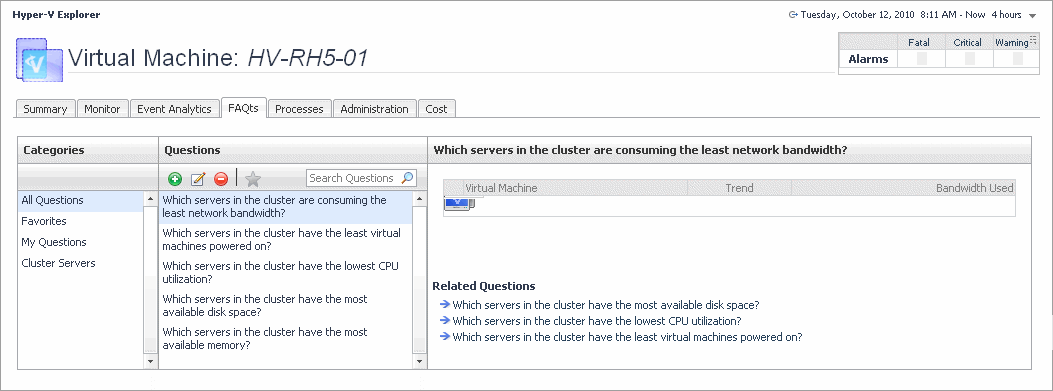
Figure 212. FAQts tab

Hyper-V Explorer FAQts tab

The Hyper-V Explorer’s FAQts tab shows answers to common questions related to a selected cluster, server, or a virtual machine.

This tab appears in the Hyper-V Explorer when you select a cluster, server, or a virtual machine on the Hyper-V Explorer Topology tab.

Figure 213. FAQts tab

This tab is made up of the following embedded views:

This view provides an answer to the question selected in the Questions view. The answer appears in the following form:

Top x <objects of category>…

where x is the number of objects of the category you provided in the Categories view.

Specify x by entering a number. The answer is relative to the subset of the infrastructure you are viewing in the dashboard. For example, the top 5 servers are different for each individual cluster in the infrastructure.

This view lists the categories for which questions can be answered for you by Foglight for Hyper-V.

Click a category in the list to select it.

This view lists the questions, for the category selected in the Categories, that can be answered for you by Foglight for Hyper-V.

Click a question in the list to select it.

If the list of questions is long and you want to narrow it down, search for a particular text string using the Search Questions box.

Hyper-V Explorer Event Analytics

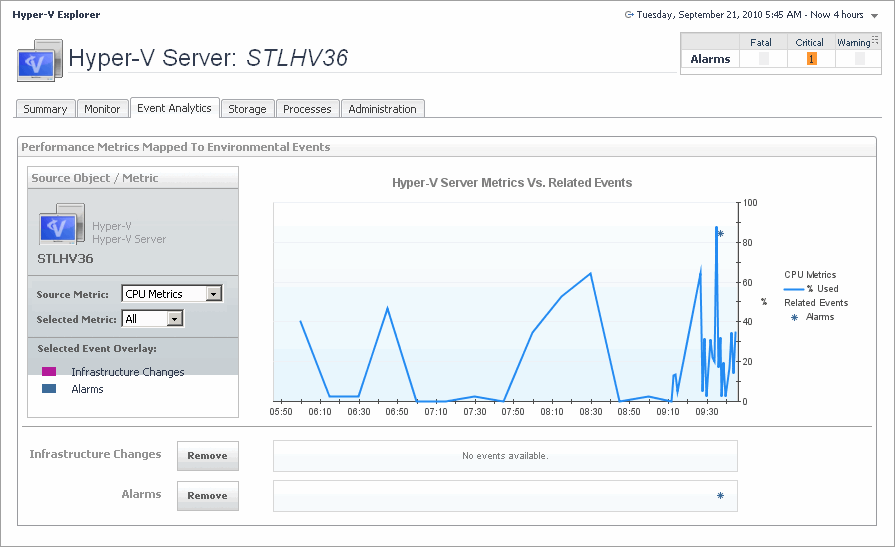
This tab only appears when you are exploring individual servers and virtual machines. It provides more details about the state of resource-related metrics over a selected time period and also shows any events that occur during that time-frame. This can give you a good idea of how the current resource consumption affects your environment as a whole. For example, a steady increase in memory consumption can often trigger memory utilization alarms, which typically indicates that you need to allocate more memory to the affected component.
Related Documents

The document was helpful.

Seleziona valutazione

I easily found the information I needed.

Seleziona valutazione