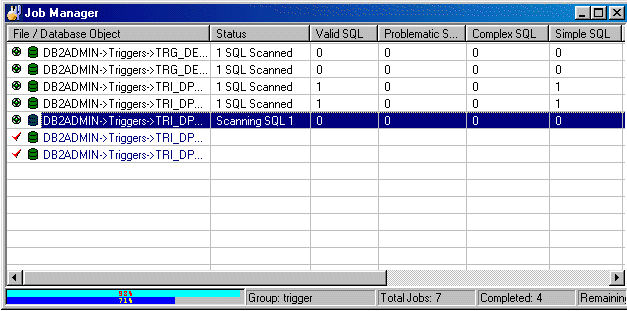
Job Manager Window

The Job Manager window consists mainly of two components: grid and status bar.
Grid
The grid from the Job Manager window stores information on each single Job in the Group.
File / Database Object
Displays the job name and associated schema.
|
Icon |
Job Type |
|---|---|
|
|
[Schema name]Object type->Object Name |
|
|
[Schema Name]Event Monitor->Event Monitor Name |
|
|
[Schema name]Text/Binary->Path\File name |
|
|
[Schema name]COBOL->Path\File name |
Status
Displays the current Job status. This column will remain blank until the Job is scanned. It will show the total number of SQL statements found.
Valid SQL
Displays the number of valid SQL statements found in the Job. Valid SQL statements are syntactically correct statements recognized by SQL Scanner, and for which DB2 LUW can provide an access plan. Valid SQL statements are further classified as Simple, Complex and Problematic SQL statements.
Problematic SQL
Displays the number of Problematic SQL statements found.
If the Show Checked SQL figures on the Job Manager window option is selected within Options, you will notice that there are two figures, first one indicates the number of Problematic SQL that have not been checked and the other (enclosed in brackets) is the number of Problematic SQL that have been checked. The total of these two figures represents the total number of Problematic SQL statements.
Complex SQL
Displays the number of Complex SQL statements found.
If the Show Checked SQL figures on the Job Manager window option is selected within Options, you will notice that there are two figures, first one indicates the number of Complex SQL that have not been checked and the other (enclosed in brackets) is the number of Complex SQL that have been checked. The total of these two figures represents the total number of Complex SQL statements.
Simple SQL
Displays the number of Simple SQL statements found.
If the Show Checked SQL figures on the Job Manager window option is selected within Options, you will notice that there are two figures, first one indicates the number of Simple SQL that have not been checked and the other (enclosed in brackets) is the number of Simple SQL that have been checked. The total of these two figures represents the total number of Simple SQL statements.
File Size
Displays the size of the Job in bytes. This cell will show "(n/a)" for Plan Tables and DB2 Event Monitors.
Started At
Displays the start date & time of when scanning began.
Processing Time
Displays the total time taken to scan the Job, time is displays in HH24:MM:SS format.
Status Bar
| Item | Description |
|---|---|
| Data Directory | Directory path where all the data files produced during scanning are saved. The data directory path can be changed in the Options window. While scanning, a progress bar will be presented to show scanning progress. The upper bar shows the current Job progress, while the lower bar shows the total Job status. |
| Group |
Name of the currently opened Group. |
| Total Jobs |
Total number of Jobs. |
| Completed |
Total number of Jobs already scanned. |
| Remaining |
Total number of Jobs that have not been scanned. |

 View the Job Manager