
Introducing Foglight APM
Monitoring Transactions
Investigating real user APM transactions
Investigating application server transactions
Configuring display options
Examining Response Times
Investigating response time breakdowns
Configuring Response Time Breakdown settings
Additional configuration options
Examining Error Breakdowns
Viewing Real User Activity from a Geographical Perspective
Using the SOC Transactions Tab
Exploring the SOC Transactions tab
Exploring response time breakdowns from the SOC
Configuring display options
Using the SOC for APM triage
Creating Custom Drag-and-Drop Dashboards
APM Tile and View Reference
Overview of APM tiles
Application Servers - .NET tile
Application Servers - Java tile
DB2 tile
Host tile
JMX tile
MQ tile
Oracle tile
OS tiles
Pivot tiles
Real User (APM) tile
Real User (FxM) tile
Sequence tile
SQL Server tile
Sybase tile
Synthetics tile
Virtual Hyper-V tile
VMware tile
Overview of Detail views
Application Server detail view
Host detail view
Pivot Breakdown detail view
Real User (APM) Performance detail view
Appendix: Enabling End User Transactions from FxM and FxV
Hits and Pages tabs
Response Time Breakdown tab
Application Infrastructure tab
Related Infrastructure tab
Real User (FxM) Performance detail view
Synthetic Result detail view
Synthetic User Performance detail view
Virtual Machine detail view
Topology object name reference table
Single-Location Synthetics tile
The Single-Location Synthetics tile displays a summary of a synthetic transaction from a single location.
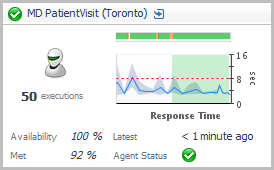 .
.Topology Object Name: FTRResult
Click the title bar to drill down to the Synthetic Result detail view.
| |||
| |||
| |||
| |||
| |||
| |||
|
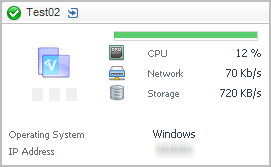
Virtual Hyper-V tile
Use the Hyper-V Tile to gather performance information about the state of virtual Hyper-V® transactions monitored by the Foglight for Hyper-V.
Figure 79. Example of the Virtual Hyper-V tile view
|
NOTE: For hosts, always select the host object, regardless of whether or not the host is virtual (for example, Hyper-V® or VMware®). Foglight looks for the appropriate host extensions and displays the associated host dashboard (physical or virtual). |
| |||
| |||
| |||
| |||
| |||
| |||
|
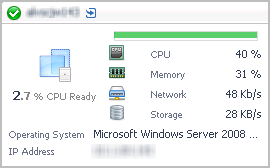
VMware tile
Figure 80. Example of the VMware tile view
|
NOTE: For hosts, always select the host object, regardless of whether or not the host is virtual (for example, Hyper-V® or VMware®). Foglight looks for the appropriate host extensions and displays the associated host dashboard (physical or virtual). |
Click the title bar to drill down to the Virtual Machine detail view.
| |||
| |||
| |||
| |||
| |||
| |||
| |||
|
Overview of Detail views
Detail views are drill down views accessible from some tile views.