
Application Server detail view
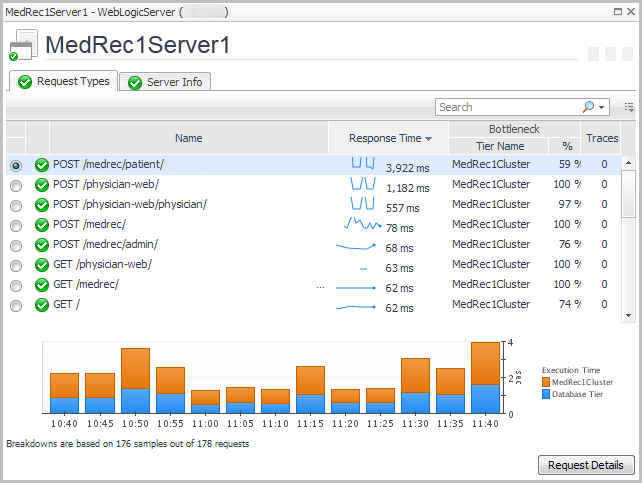
The Request Types tab lists the following information for each request type: request name, response time, bottleneck location (based on the most time-consuming tier of a request), calls completed, calls incomplete, call exceptions, and number of traces.
The chart shows the tier breakdown for the selected request.
The information presented on the Server Info tab depends on the type of application server selected: JBoss®, OracleAS, Apache Tomcat, WebSphere®, or WebLogic®.
|
• |
Host detail view
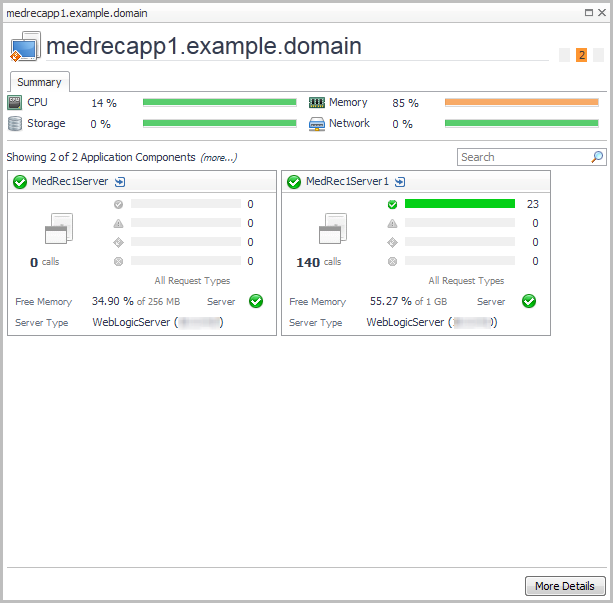
The banner shows host metrics if the host is monitored. Click More Details to see the performance details for the host.
If the host is not monitored, then:
|
• |
If the host is not part of a Federated environment, and the Foglight Cartridge for Infrastructure is installed, click Add OS Monitor to configure host monitoring. For information, see the Foglight for Infrastructure User and Reference Guide. |
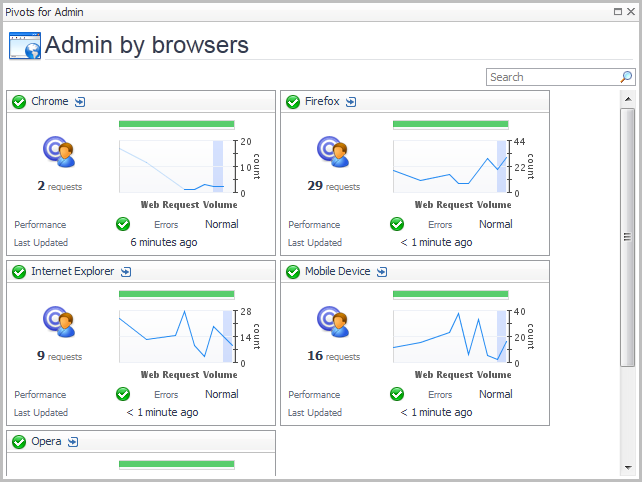
Pivot Breakdown detail view
The Pivot Breakdown detail view provides a tile for each pivot type that is included in the pivot roll up tile you clicked. For example, for a web browser pivot roll up tile, the breakdown detail view can include tiles for each of the following browser types: Chrome™, Firefox®, Internet Explorer®, Mobile Devices, and Opera™.
Each tile displays: requests, request volume, overall health, performance and error status, and the last updated time. For more information, see Pivot tiles.
Real User (APM) Performance detail view
To access this view, click the title bar of a Real User (APM) tile, or from the Geographical Perspectives dashboard, click Transaction Detail for an APM transaction.