When navigating to the Cloud Manager dashboard for the first time, the Monitoring tab appears. The Monitoring tab allows you to select a monitoring object or a group of objects, such as projects, regions, instances groups, or VM instances, and review the data associated with your selection.
|
3 |
|
4 |
On the actions bar, click Monitoring. |
|
5 |
For more information, see the following topics:
|
• |
|
• |
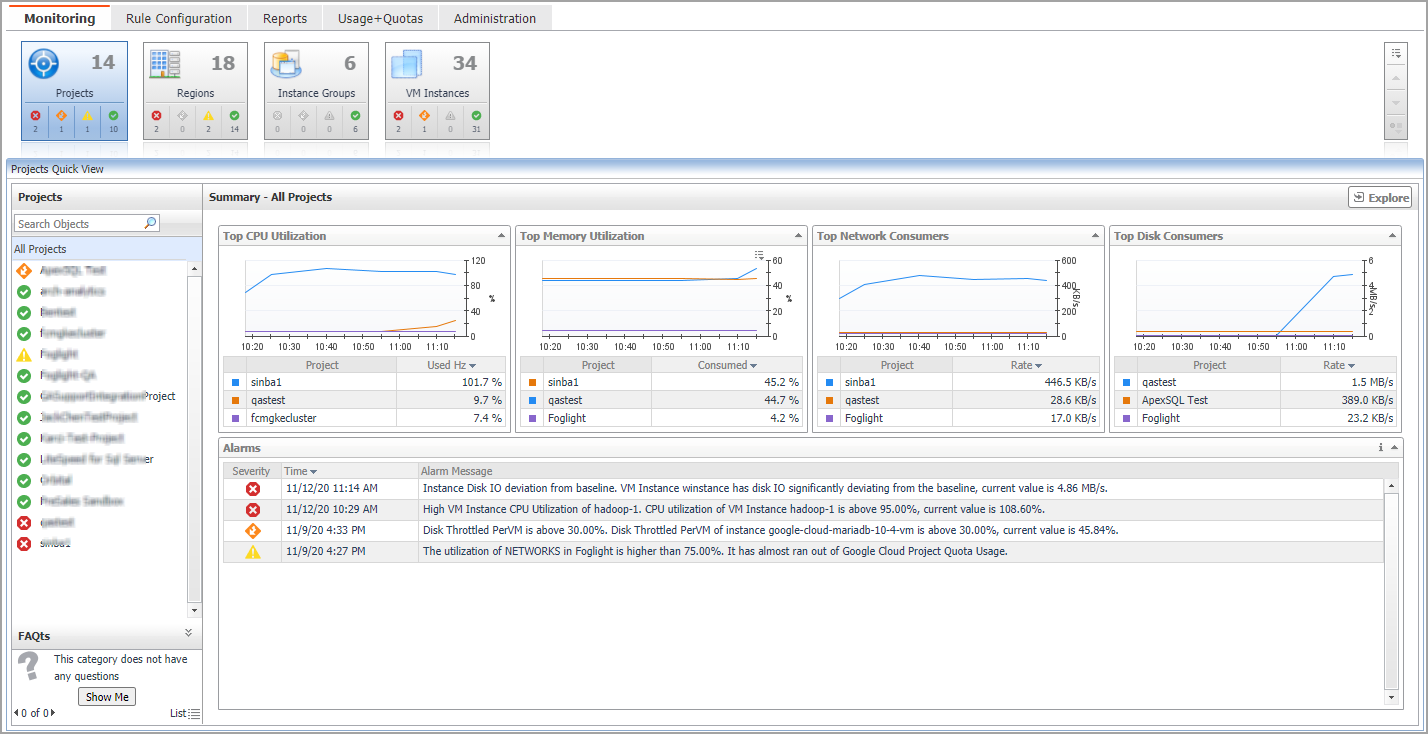
The Projects view shows the data collected for a specific or all Google Cloud projects.
The Projects Quick View displays the following features:
|
• |
Summary - All Projects view: Shows the projects with Top CPU Utilization, Top Memory Utilization, Top Network Consumers, and Top Disk Consumers. |
|
• |
Resource Information: Shows the basic information for the selected project, including Parent, Project Number, Default Network Tier, Default Service Account, XPN Project Status, and Life Cycle State. |
|
• |
Related Items: Shows the relation and hierarchy for the selected project. |
|
• |
Resource Utilization: Shows the CPU Utilization, Network Utilization, Memory Utilization, and Disk Utilization for the selected project. |
|
• |
Alarms: Shows all the alarms related to the selected project, or all the alarms related to the projects under the selected service. |
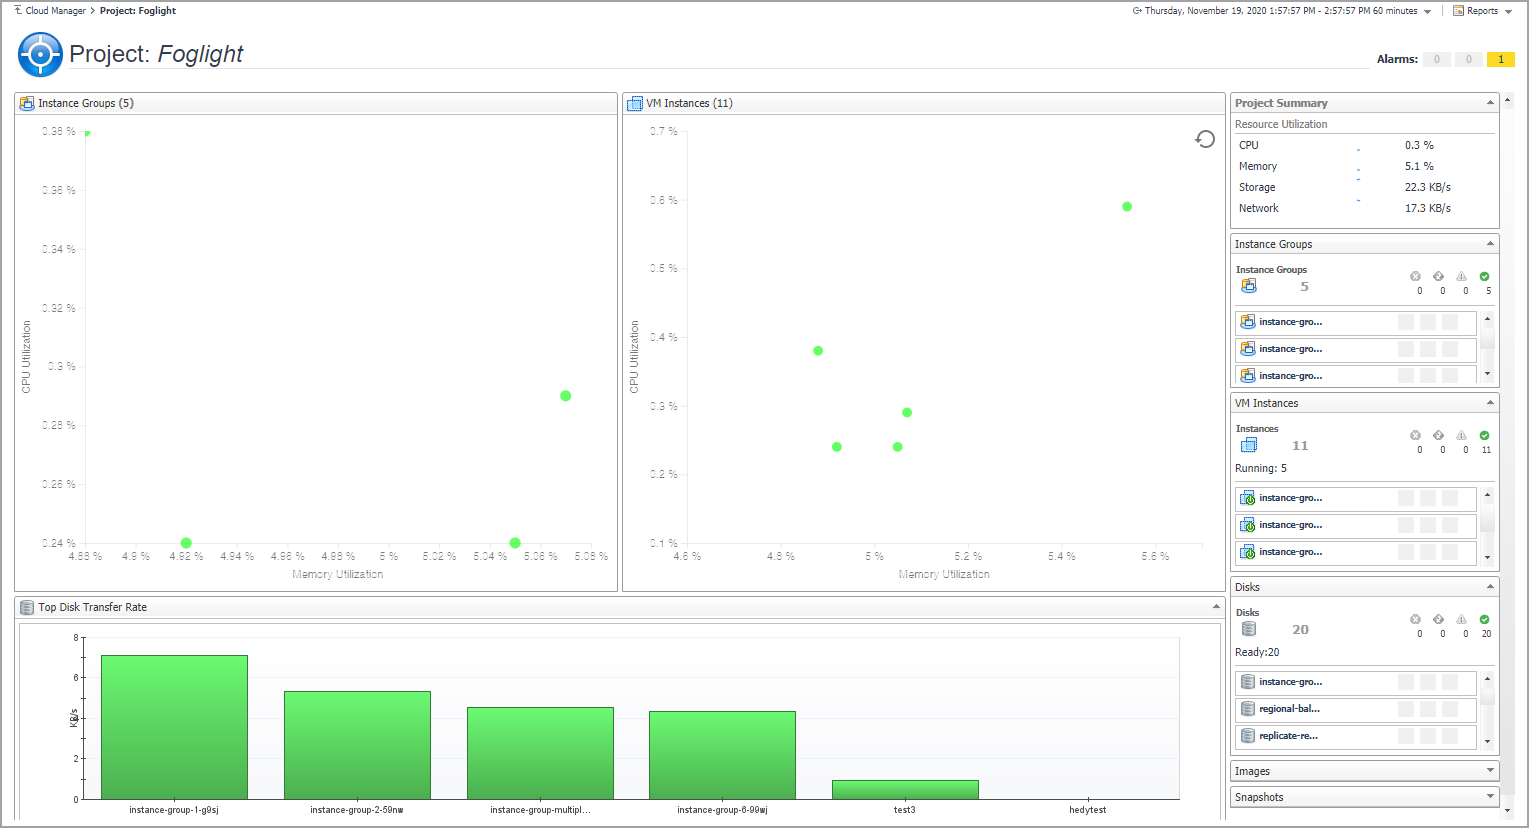
Click Explore to open the Project Explorer view.
The Project Explorer view visually displays the detailed information of the project.
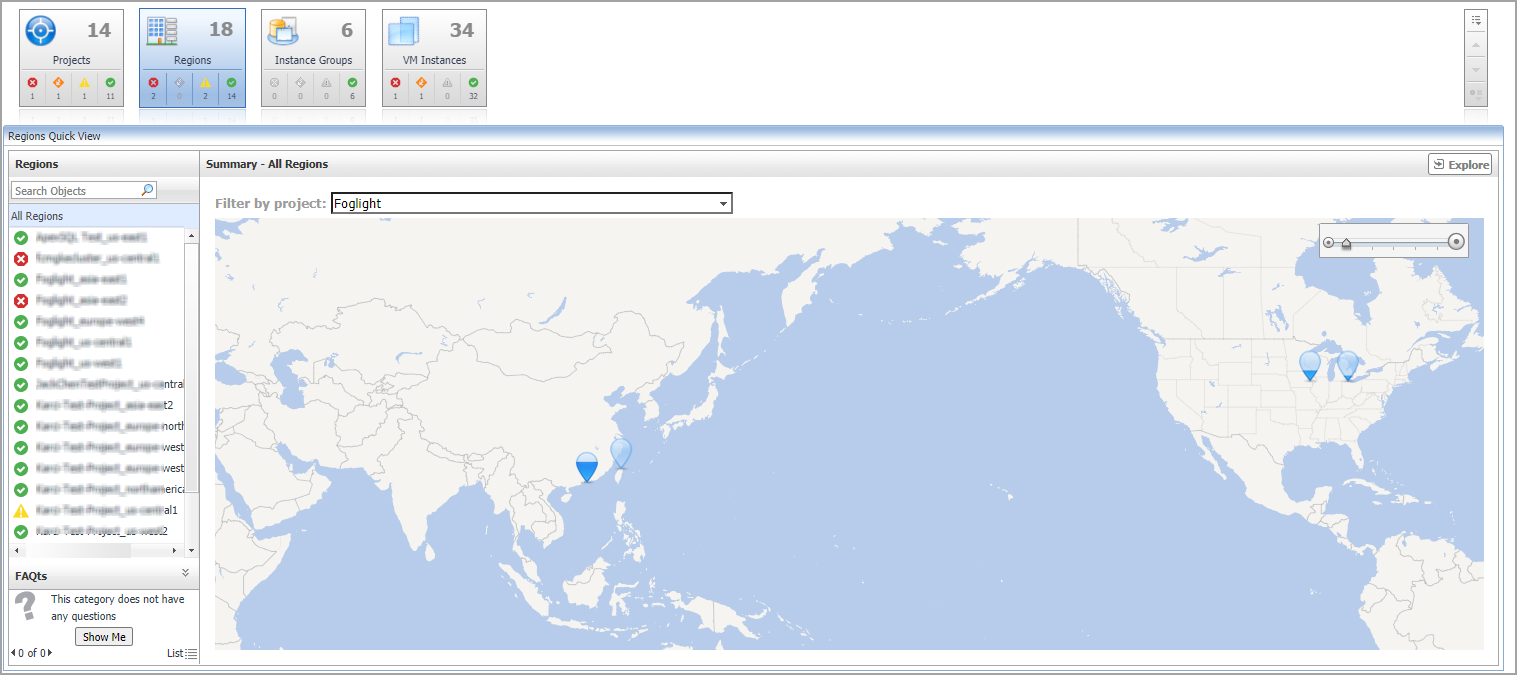
The Regions view shows the data collected about a specific region or all Google Cloud regions.
The Regions Quick View displays the following features:
|
• |
Summary - All Regions view: Choose different projects by Filter by project and view the region where the VM instances belongs to. |
|
• |
A single Region Details view |
|
• |
Related Items: Shows the relation and hierarchy for the selected region. |
|
• |
VM Instances table: Shows the Status, Name, CPU Utilization, and Memory Utilization of the VM Instances for the selected region. |
|
• |
Alarms: Shows all the alarms related to the selected region, or all the alarms related to the regions under the selected service. |
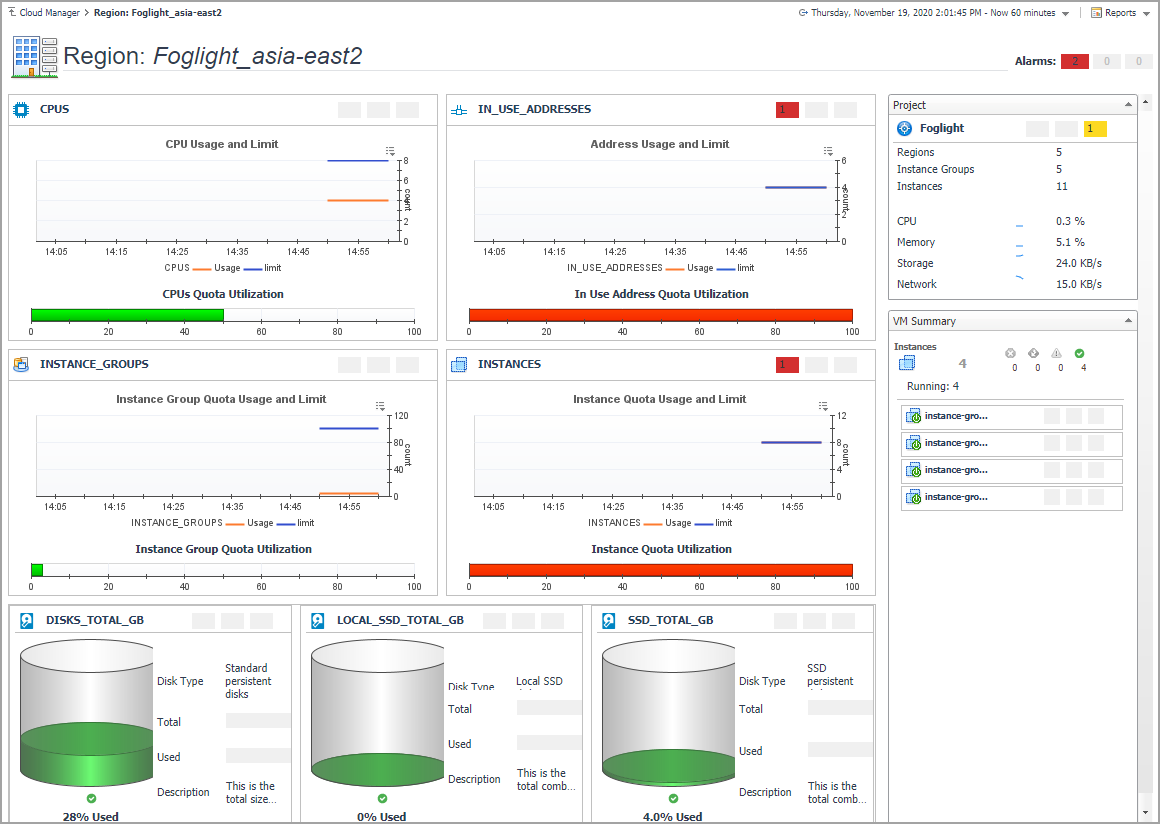
Click Explore to open the Region Explorer view.
The Region Explorer view visually displays the detailed information of the region.
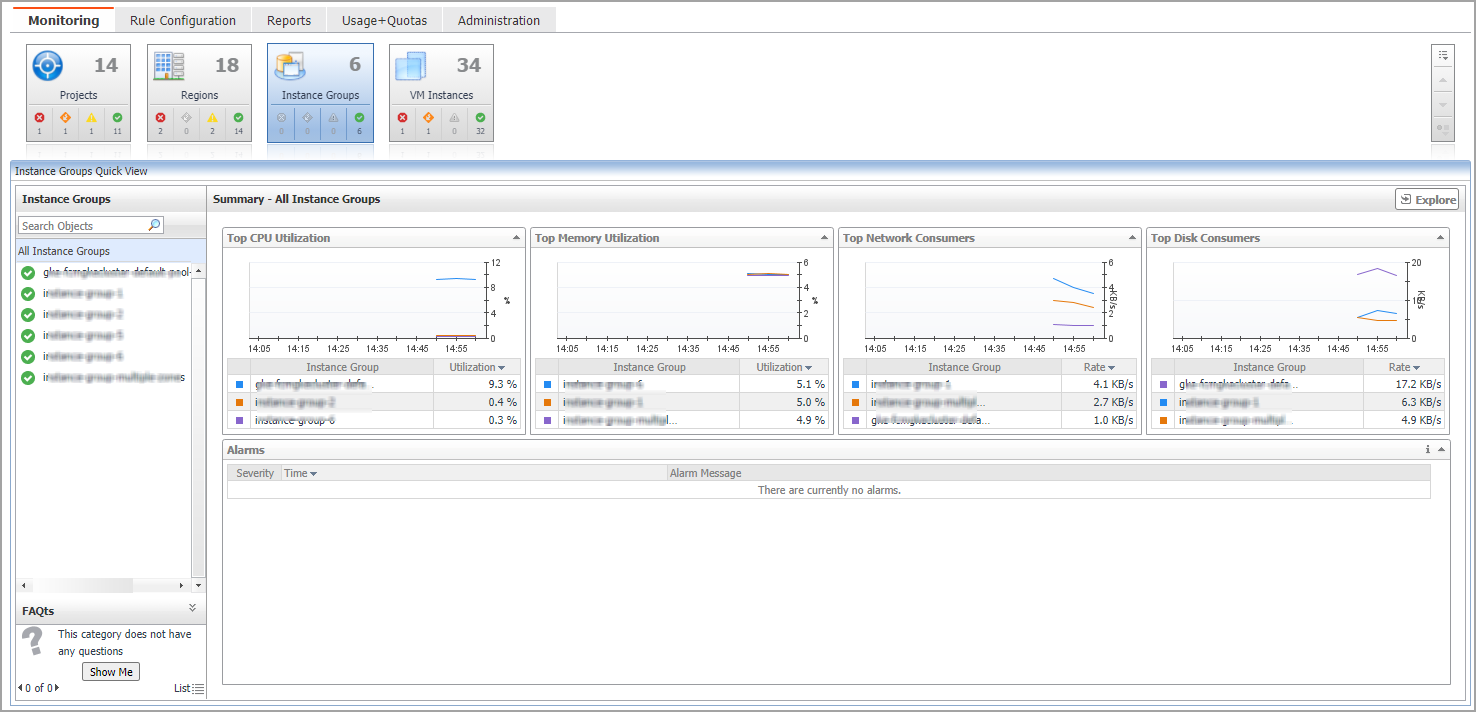
The Instance Groups view shows the data collected for a specific or all Google Cloud instance groups.
The Instance Groups Quick View displays the following features:
|
• |
Summary - All Instance Groups view: Shows the instance groups with Top CPU Utilization, Top Memory Utilization, Top Network Consumers, and Top Disk Consumers. |
|
• |
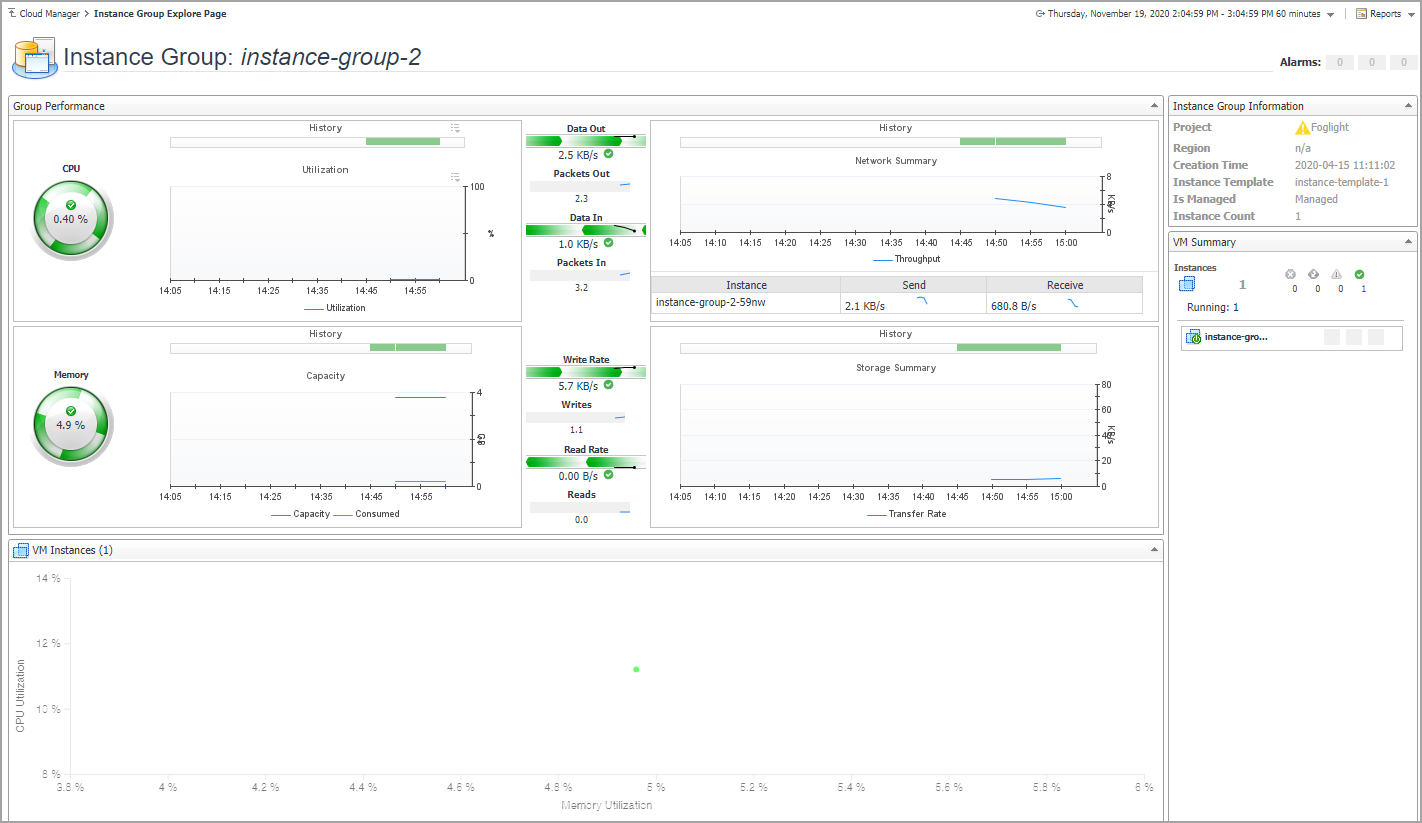
A single Instance Group Summary view |
|
• |
Instance Group Information: Shows the basic information for the selected instance group, including Project name, Region, Creation time, Instance Template, Is Managed, and Instance Count. |
|
• |
Related Items: Shows the relation and hierarchy for the selected instance group. |
|
• |
Resource Utilization: Shows the CPU Utilization, Network I/O, Memory Utilization, and Disk I/O for the selected instance group. |
|
• |
Alarms: Shows all the alarms related to the selected instance group, or all the alarms related to the instance groups under the selected service. |
Click Explore to open the Instance Group Explorer view.
The Instance Group Explorer view visually displays the detailed information of the instance group.