|
|
|
Number of processors installed on the target system. Speed of the processor(s) installed on the target system. Type of processor(s) installed on the target system (Intel Pentium III, for example). Shows how long it has been since Windows was started on the machine being diagnosed. The Virtualization Overhead gauge shows the percentage of CPU that is unavailable to this virtual machine because it is being consumed either by other virtual machines or by VMware itself. In a virtual environment, the physical CPU of a host is shared by virtual machines and the VMware Hypervisor. This means there can be multiple processes wanting to use the physical CPU of the host at the same time. The result is that virtual machines may be ready to run but have to wait to be scheduled on a CPU. Vmware call this “ready time”. The Virtualization Overhead gauge shows the amount of ready time as a percentage of the theoretical maximum CPU available to the virtual machine. See "Configure the Virtualization Overhead Guage" (page 1) for more information. Represents the total amount of CPU being used on the machine being diagnosed. It includes CPU consumed by all windows processes. This component spins faster as CPU demands increase. Shows the number of threads (program execution units) that are waiting on all processors to be run. A sustained processor queue length greater than ten can indicate processor congestion. Shows the number of applications and services that are currently active on the system.) Shows the number of threads currently active in all processes. A thread is a running portion of the owning process. Every process has at least one thread. Shows the number of memory pages per second that are being written to disk from physical memory, in order to free up physical memory. The memory pages are checked first to see if they have been modified - if no modification has taken place, they are discarded. This is a measure of the number of page faults per second on the system. This value includes soft faults and hard faults. A page fault occurs when a process requires code or data that is not in its space in physical memory. A soft fault is when a memory page is not in the physical memory of the process, but resides in another segment of physical memory. A hard fault occurs when a memory page is not in the physical memory of the process, and has to be brought from disk. Shows the rate at which cache pages are written to disk from memory, in order to satisfy a write through request (an application request to not write information to cache, but directly to disk) or a cache flush (a regular writing of data from the write-cache to disk). Shows the rate at which cache pages are read by applications from memory. |
Spotlight on Windows Home Page (page 1)

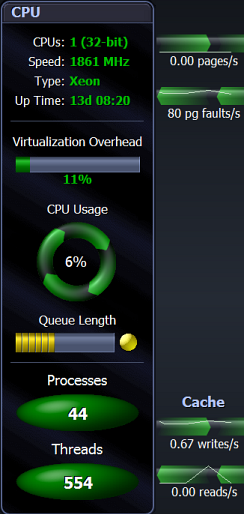
 CPUs
CPUs