The SQL Memory panel displays the following information:
|
|
This shows the total amount of memory that SQL Server is currently using. If properly configured, SQL Server's use of memory will vary depending on SQL Server activity, and memory demands by non-SQL Server processes. This shows the amount of memory currently being used by SQL Server as a percentage of the maximum amount of memory that SQL Server is configured to use. The maximum memory is the lower of SQL Server's max memory setting, and the amount of physical RAM on the server. The Memory gauge shows the total memory that SQL Server is currently using, scaled against the maximum amount of memory it could use. By default, SQL Server dynamically manages its memory. It will request extra memory from the operating system as required to satisfy the queries being run. SQL Server also monitors the stress on the Windows memory manager, and when it finds that the memory manager is having trouble satisfying the memory requests of other Windows processes, SQL Server will voluntarily release some of its memory back to Windows. This dynamic memory management means SQL Server can automatically tune its memory allocations based on the load it is processing, and the demands of other Windows processes on the server. Each page of memory used by SQL Server is assigned to one of several caches. Each cache will grow and shrink in size as required. The main caches are the Buffer Cache, which holds recently accessed database pages, and the Procedure Cache which holds recently compiled query execution plans. This Memory gauge shows the total amount of memory currently allocated to SQL Server. The maximum value shown on this gauge is the lower of SQL Server's Max Memory parameter and the amount of physical RAM on the machine. It indicates the maximum amount of memory SQL Server can use. Two SQL Server parameters can be used to influence the amount of memory SQL Server uses. The Min Memory and Max Memory parameters both default to 0, which causes SQL Server to manage its total memory use as it sees fit. However, you can set these parameters to non-zero values. A non-zero Max Memory parameter causes SQL Server to never request more than that amount of memory. A non-zero Min Memory parameter prevents SQL Server from giving memory back to Windows if its total memory allocation is less than the value specified. Note that SQL Server does not automatically request this amount of memory on startup, but will request additional memory from Windows as it needs it, and will not release any memory back to the operating system until it has allocated more than this "minimum" amount. Clicking this gauge takes you to the SQL Memory drilldown, which shows you how SQL Server is currently using its memory. This shows the amount of memory currently allocated to the Buffer Cache. The Buffer Cache is an in-memory copy of recently used database pages. This gauge shows the current Buffer Cache Hit Rate. SQL Server holds recently accessed database pages in a memory area called the Buffer Cache. If a SQL process needs to access a database page, and that page is already in the Buffer Cache, then SQL Server does not need to read the page from disk. This can save a significant amount of disk I/O, and can speed up queries significantly. Buffer Cache Hit Rate is the ratio of logical reads to physical reads. It indicates the percentage of data/index page lookups that were satisfied from the Buffer Cache, and therefore did not have to perform disk reads. It shows you how efficiently SQL Server is using the memory allocated to its Buffer Cache. Spotlight on SQL Server calculates its hit rates using a differential sampling method. The hit rate shown is for the last few sample periods only. Unlike most SQL Server monitors, it is not reporting the average hit rate since SQL Server started. This shows the current Page Life Expectancy. SQL Server holds recently accessed database pages in a memory area called the Buffer Cache. If a SQL process needs to access a database page and that page is already in the buffer cache, then SQL Server does not need to read the page from disk. This can save a significant amount of disk I/O and can speed up queries significantly. Page Life Expectancy is the length of time in seconds that a database page will stay in the buffer cache without references. Large values mean that pages are staying in the buffer cache longer and that the buffer cache is behaving efficiently. Small values mean that pages are being flushed out of the cache within a small period of time and that the buffer cache is not being effective. Microsoft recommends 300 seconds as the minimum value for this; any less is indicative of a shortage of memory. This shows the amount of memory currently allocated to the Procedure Cache. The Procedure Cache holds execution plans for stored procedures, triggers, adhoc SQL, and so on. This gauge shows the current Procedure Cache Hit Rate. SQL Server holds recently compiled query execution plans in a memory area called the Procedure Cache. If a SQL Server process runs a query or executes a stored procedure, SQL Server first checks if the required execution plan is already in the Procedure Cache. If a matching plan is found, then SQL Server does not need to compile the query/stored procedure. This can save a significant amount of CPU resources, and can speed up SQL Server queries. The Procedure Cache Hit Rate is the percentage of Procedure Cache lookups that found the required plan already in the cache. It shows you how efficiently SQL Server is using the memory allocated to its Procedure Cache. The Procedure Cache Hit Rate is the average hit rate for all Procedure Cache object types, except for Adhoc SQL and SQL Server 2000 Execution Contexts. Spotlight excludes Adhoc SQL and Execution Contexts from this figure in order to give a more accurate representation of plan caching efficiency. The hit rate for all object types (including Adhoc SQL) is available on the Memory drilldown. Spotlight on SQL Server calculates its hit rates using a differential sampling method. The hit rate shown is for the last few sample periods only. Unlike most SQL Server monitors, it is not reporting the average hit rate since SQL Server started. This flow from the Disk Storage panel to the SQL Memory panel represents normal page reads per second. When a connection needs a page that is not already in the Buffer Cache, SQL Server issues an I/O request, and the user is required to wait until the page has been read before they can continue. This flow represents data/index pages written to disk. Normally SQL users don't have to wait for database write operations to complete. Most modifications to database pages are made in the Buffer Cache, and, once the change has been recorded in the Log, the user can continue without having to wait for the modified pages to be written to disk. This flow from the Disk Storage panel to the SQL Memory panel represents pages being read from disk before they are requested. When SQL Server thinks data or index pages are being read in a sequential manner, it will pre-fetch the pages into the Buffer Cache before they are requested by the user. This is known as Read Ahead processing. Read Ahead can improve the performance of queries that have to process a lot of table or index pages sequentially, by having the pages already in the Buffer Cache before they are required. In some circumstances, a high level of Read Ahead activity can be an indication of poorly-coded SQL or inadequate indexes. Read Ahead processing is triggered by table scans or index range scans. In some cases, defining more suitable indexes or tuning SQL statements can get SQL Server to use more efficient access methods (e.g. direct index accesses) instead of these scans. This flow from the SQL Memory panel to the Background Processes panel represents the number of pages being written to disk by the Checkpoint process. Represents the number of pages per second that the lazy writer is flushing to disk. This flow from the SQL Memory panel to the Background Processes panel represents the number of log pages being written to disk by the Log Writer process. |

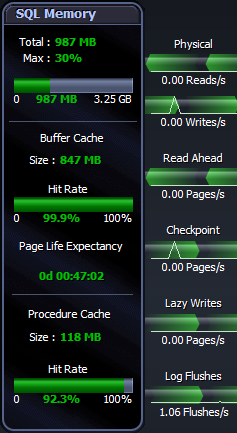
 Total SQL Server Memory