FAQ tab
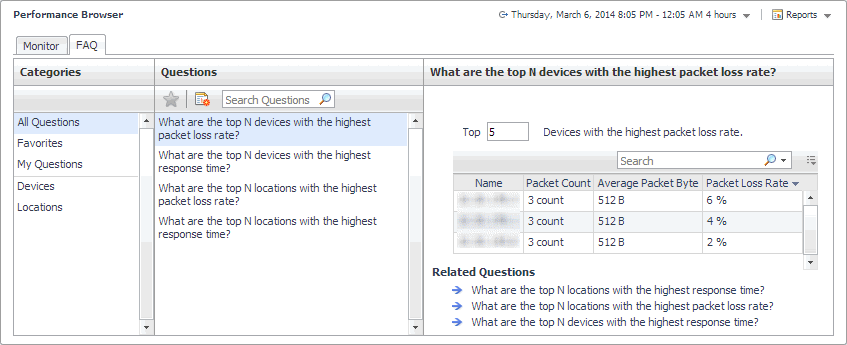
The FAQ tab shows answers to common questions related to your network devices or monitoring locations.
Navigate to the Performance Browser, and open the FAQts tab.
This view is made up of the following embedded views:
|
• |
This view provides an answer to the question selected in the Questions view. The answer appears in the following form:
Top x <objects of category>…
Where x is the number of objects of the category you provided in the Categories view.
Specify x by entering a number.
This view lists the categories for which questions can be answered for you by Foglight.
Click a category in the list to select it.
This view lists the questions, for the category selected in the Categories, that can be answered for you by Foglight.
Click a question in the list to select it.
If the list of questions is long and you want to narrow it down, search for a particular text string using the Search Questions box.
FAQts view
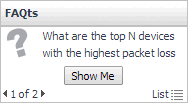
The FAQts view shows answers to common questions related to your transactions or locations. The collection of available questions depends on the tile selected in the Net Monitor Environment view. If you select the Network Devices tile, this view displays the questions related to the monitored network devices. Selecting the Monitor Locations tile causes the view to display the questions related to your monitoring locations.
In the Performance Browser, in the Quick View, the FAQts view appears in the bottom-left corner.
Net Monitor Environment view
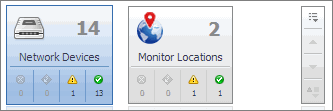
The Net Monitor Environment view displays a high-level overview of your monitored environment. The view has two tiles, each representing the monitored objects of interest: Network Devices and Monitor Locations.
Clicking the object type icon, the object type name, or the object count, shows summary information for that object type in the Quick View. Clicking an alarm state (for example, Warning) on a tile displays summary information in the Quick View for the objects of that type that are in the selected alarm state. If an alarm state has a count of zero, then you can not drill down on the alarm state.
This view appears in the upper part of the Performance Browser, just above the Quick View.
This view is made up of the following embedded views:
| |||||
|
| |||||
|
Network Devices view
The Network Devices view lists the monitored network devices and shows their alarm states.
Selecting All Network Devices shows the overall response and availability information for the monitored devices in the Summary - All Devices view on the right. Similarly, selecting a device in the list shows device-specific metrics in the Summary - Single Device Summary view view on the right.
|
• |
| |||||||
|


