Nova has a section type called Card'. Using this feature you can include simple sum, count, maximum, minimum or average values which might add useful additional information to your reports.
For example you could show the total count of mailboxes in an organization, or the number of users in a tenant, or the total size of all mailboxes in an organization.
In this section, we will see an example of how this can be done.
9.Select an operator and an Applied to data field.
10. Add a filter group, if applicable. For example, you may want to know how many Microsoft Entra ID users have their country or reigon' parameters set to the United States.
11. Optionally, you can set analytics to 'color code' your card section. More on analytics is below.
Click save, and close the section.
|
|
NOTEs: ·The reports take a period of time to update to real time; this is usually between 24 to 48 hours. For more on this, click here. ·You can add up to 6 cards in a report. |
Analytics
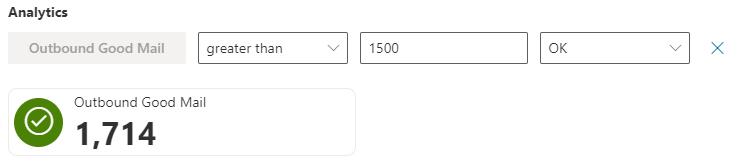
The analytics tool is a quick way to see if a statistic in your environment is not as it should regularly be.
For example, you may want to immediately know the amount of spam mail coming into your tenant. You can select an operator relating to the value you want to input, for example you can have:
·greater than
·less than
·equal to
·is not equal to
then input a number. We can then apply the severity of the issue to the number applied. These include:
·OK
·Warning
·Critical
Custom card example: Teams private message count (7 days)
For example, you may want to keep an eye on the amount of Teams chats your users are sending if your environment has just adopted the Teams platform. You may also want to set a target for what you may deem acceptable. This can be achieved with the following steps:
|
1.Enter a card title, for example Teams Chats (7 days). 2.For the data source, select Teams User Activity Aggregate. 3.Choose your organization and organization groups, if required. 4.For operator, select Count. 5.For Applied to, select Private Chat Message Count (7 Days). 6.Under Analytics, select your Operator, Value and Severity to your needs. 7.Save and close the section. |
You may need some overall context for the section(s) in your report for the report to make sense to new viewers. The text feature within the Report Center is a great method to help you expand on any additional information for either your report as a whole or for individual sections.
There are a range of features you can use when creating your text section. These include but are not limited to:
·adding hyperlinks to words or phrases. Add additional links to external information.
·use headers to highlight different sections.
·use numbered lists or bullet points.
There is no character limit, so insert as much information as you need into your text section.
Filtering your charts and tables and dates is easy to do. You are able to search within very specific time frames for a variety of data sources and data source categories.
To filter your data to within certain time frames:
1.Go to your chosen report that you have already created, or begin by building one. Ensure that your report is one in which date is a valid property.
2.Go to Add filter group.
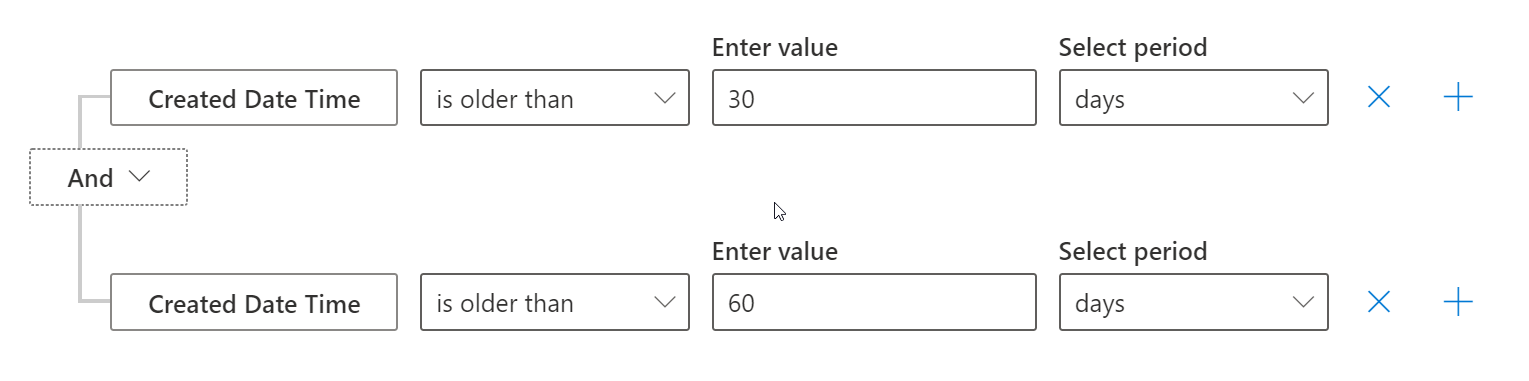
3.In Select field..., select the date property. This could take multiple forms, including Date, Activity Date, Created Date Time. Deleted Date Time, and so on. This depends on which data source you have selected.
4.Then select the parameters of your date filtering.
a.With is newer than, these are dates AFTER your parameters. For example, is newer than 1 year is within the past year up to this point.
b.With is older than, these are dates BEFORE your parameters. For example, is older than one year includes dates before the past year, not including the past year.
You are also able to add another filter so you can include dates within a specific time frame i.e. between 30 and 60 days. This is possible by clicking the plus button and repeating the steps above. Ensure that you have selected AND, rather than OR, if you are filtering between two dates. This can be seen in the image below.
|
|
NOTE: A maximum of 10 filters can be added to a section of a report. |
Filtering by QTD/YTD
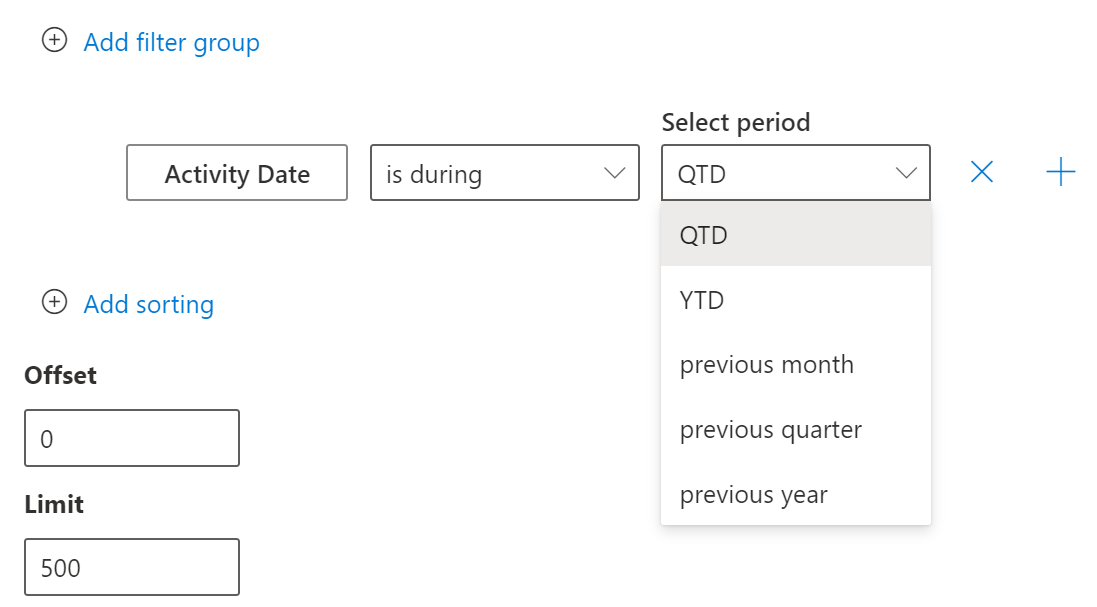
It is possible to search within Quarter to Date (QTD) and Year to Date (YTD) metrics within the Nova Report Center for date-specific data fields.
The QTD parameter gives you data from the beginning of the current quarter, and ending at the current date.
The YTD parameter gives you data from the beginning of the current year, and ending at the current date.
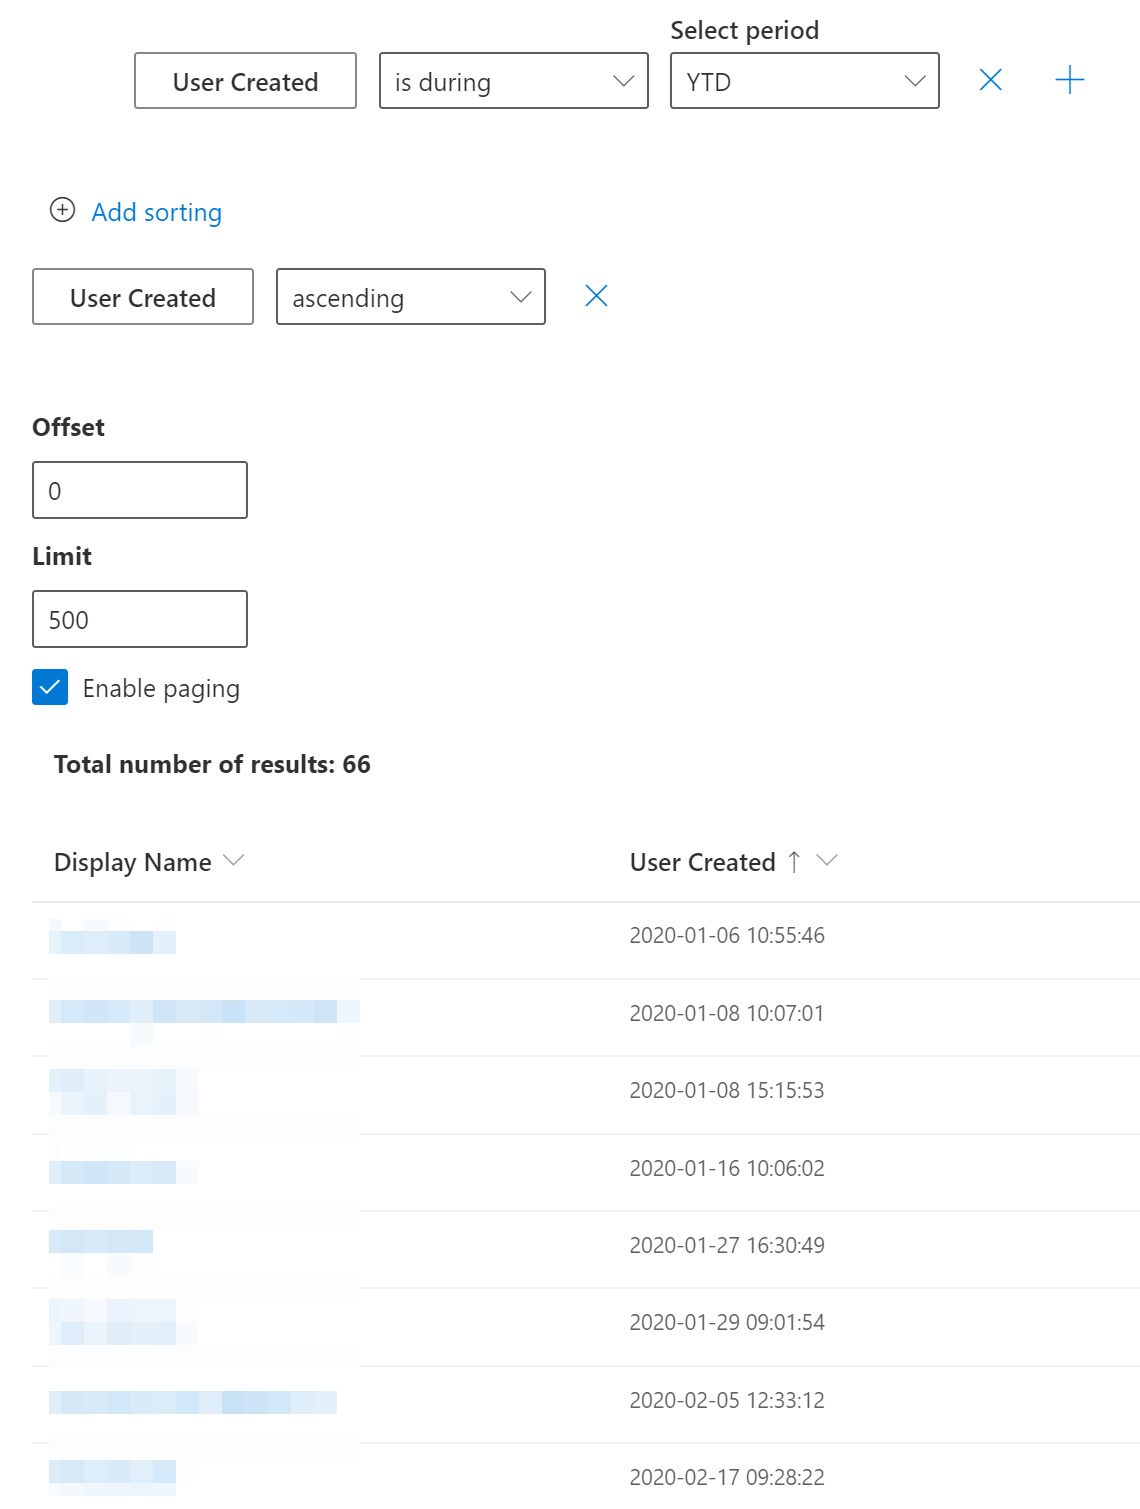
For example, perhaps you want to see the amount of Microsoft Entra ID users created within the current year within your tenant. To do this:
1.Begin by creating a new report, including title and description if necessary.
2.Choose your data source. For these specific filters, you will need sources that include date data fields. For our example, we are using Microsoft Entra ID Users.
3.For Table fields, choose Display Name and User Created.
4.Under Add filter group, select is during, then YTD.
5.Add sorting and change your offset and limits if required.
Below is an example of what your report should look like.
Sorting
You can sort in ascending and descending order for any data field, even fields that you have not included in your report section. To add a searching parameter:
1.In your report section, click Add sorting.
2.Select the data field you would like to sort by.
3.Choose between ascending (smallest to largest, A-Z) and descending (largest to smallest, Z-A).
Alternatively, you can click on the heading of a table section to sort that specific field.
There are three ways that table data can be filtered.
Filtering the Table
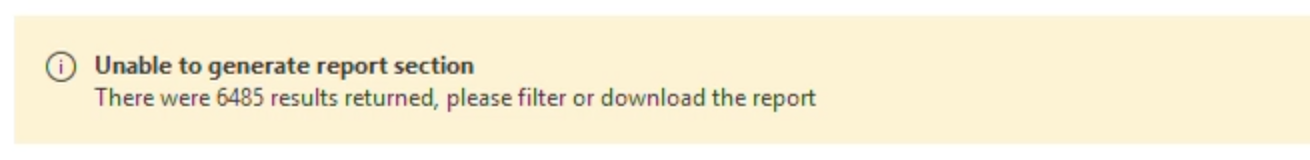
If you have a large report Nova might indicate that there are too many results to display them, like this:
Other times you might just want a subset of users, for example if you want users beginning with the letter D.
In these situations you can filter the data, by:
1.Clicking on Add Filter'
2.Choosing an appropriate field, like Display Name'.
3.Choosing an operator like Contains' or Begins with'
4.Entering the filter or search criteria.
You can see how to do it in this short video.
Global filtering
You can also do a global filter on a report to provide some helpful filtering to a user of the report.
To do this you:
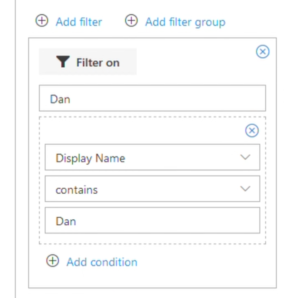
1.Click Add report filters' at the top of the report
2.Click Add filter'
3.Give the filter a name.
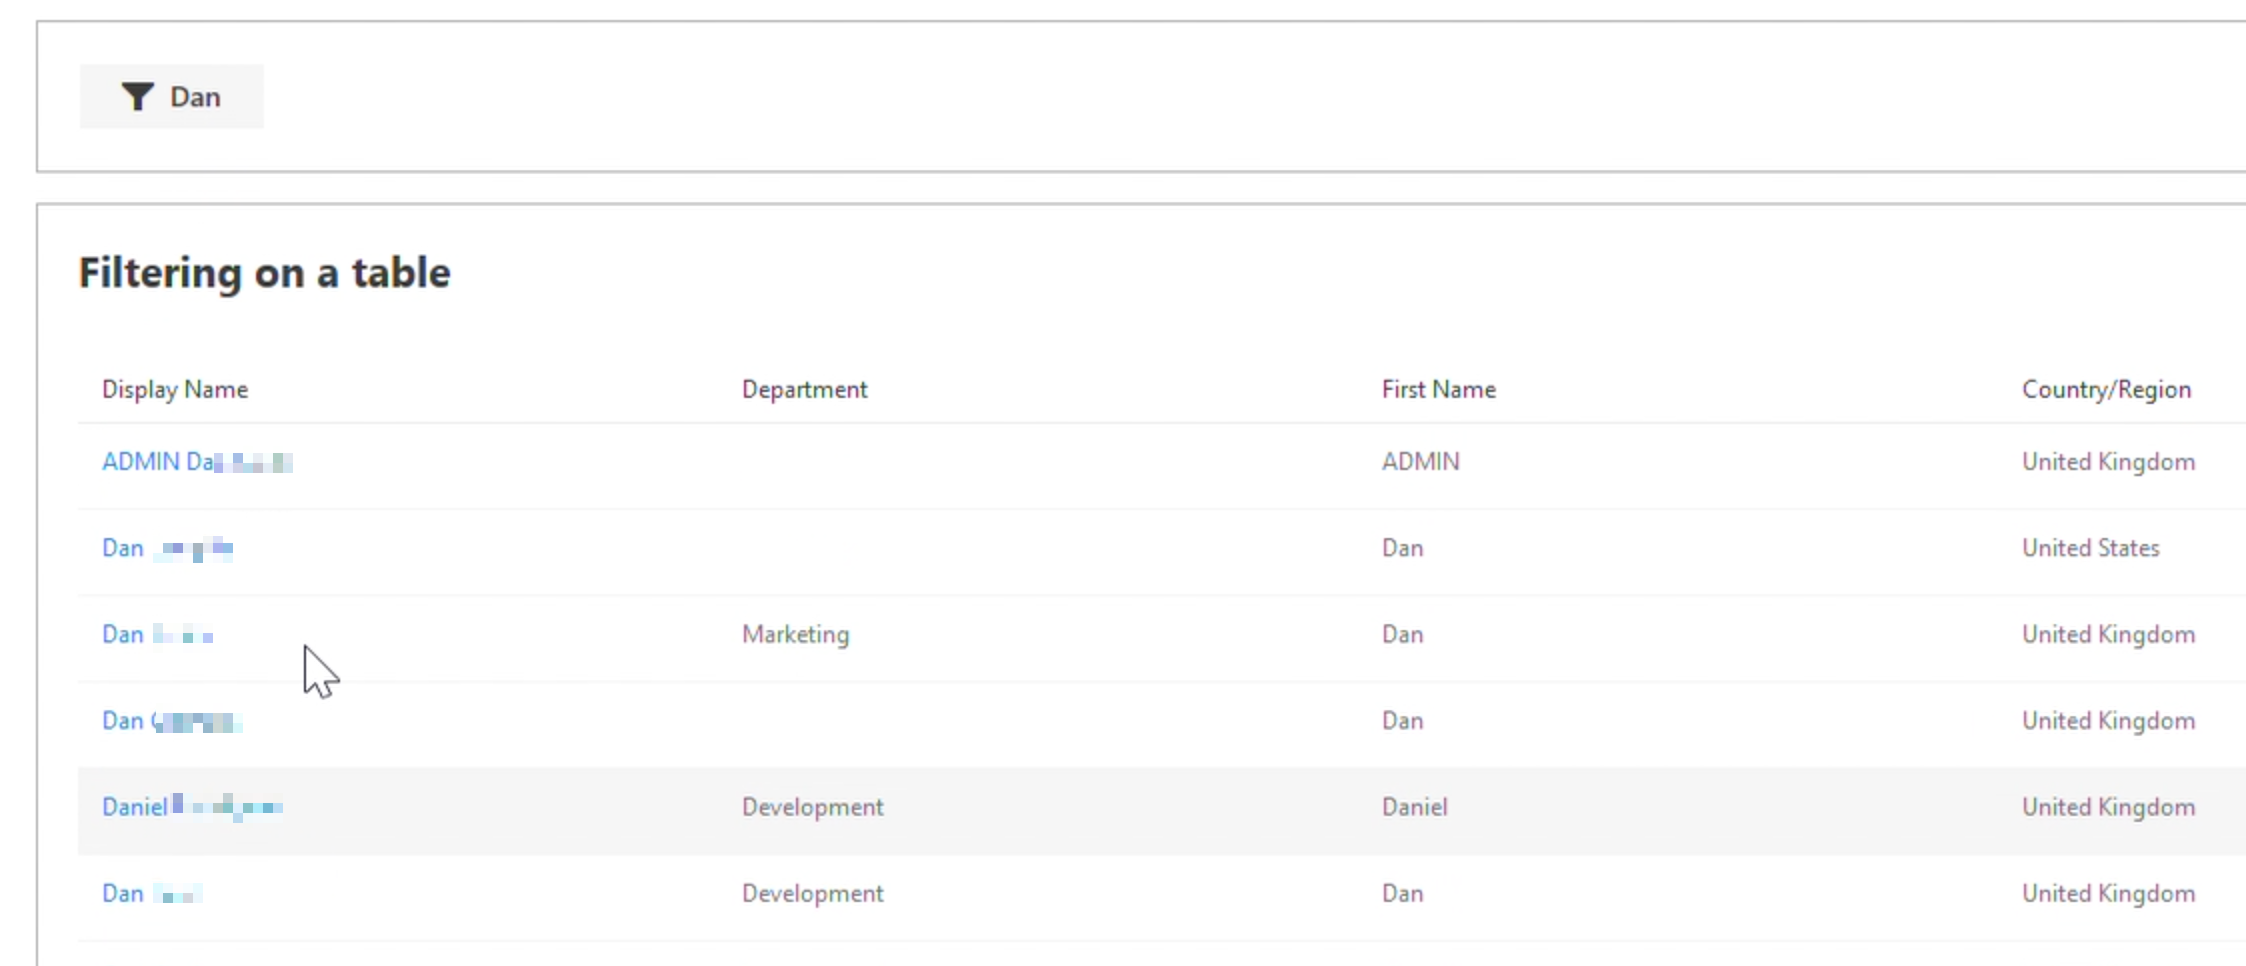
4.Click on Add condition'
5.Enter the filter criteria, for example Display Name', contains', Dan'.
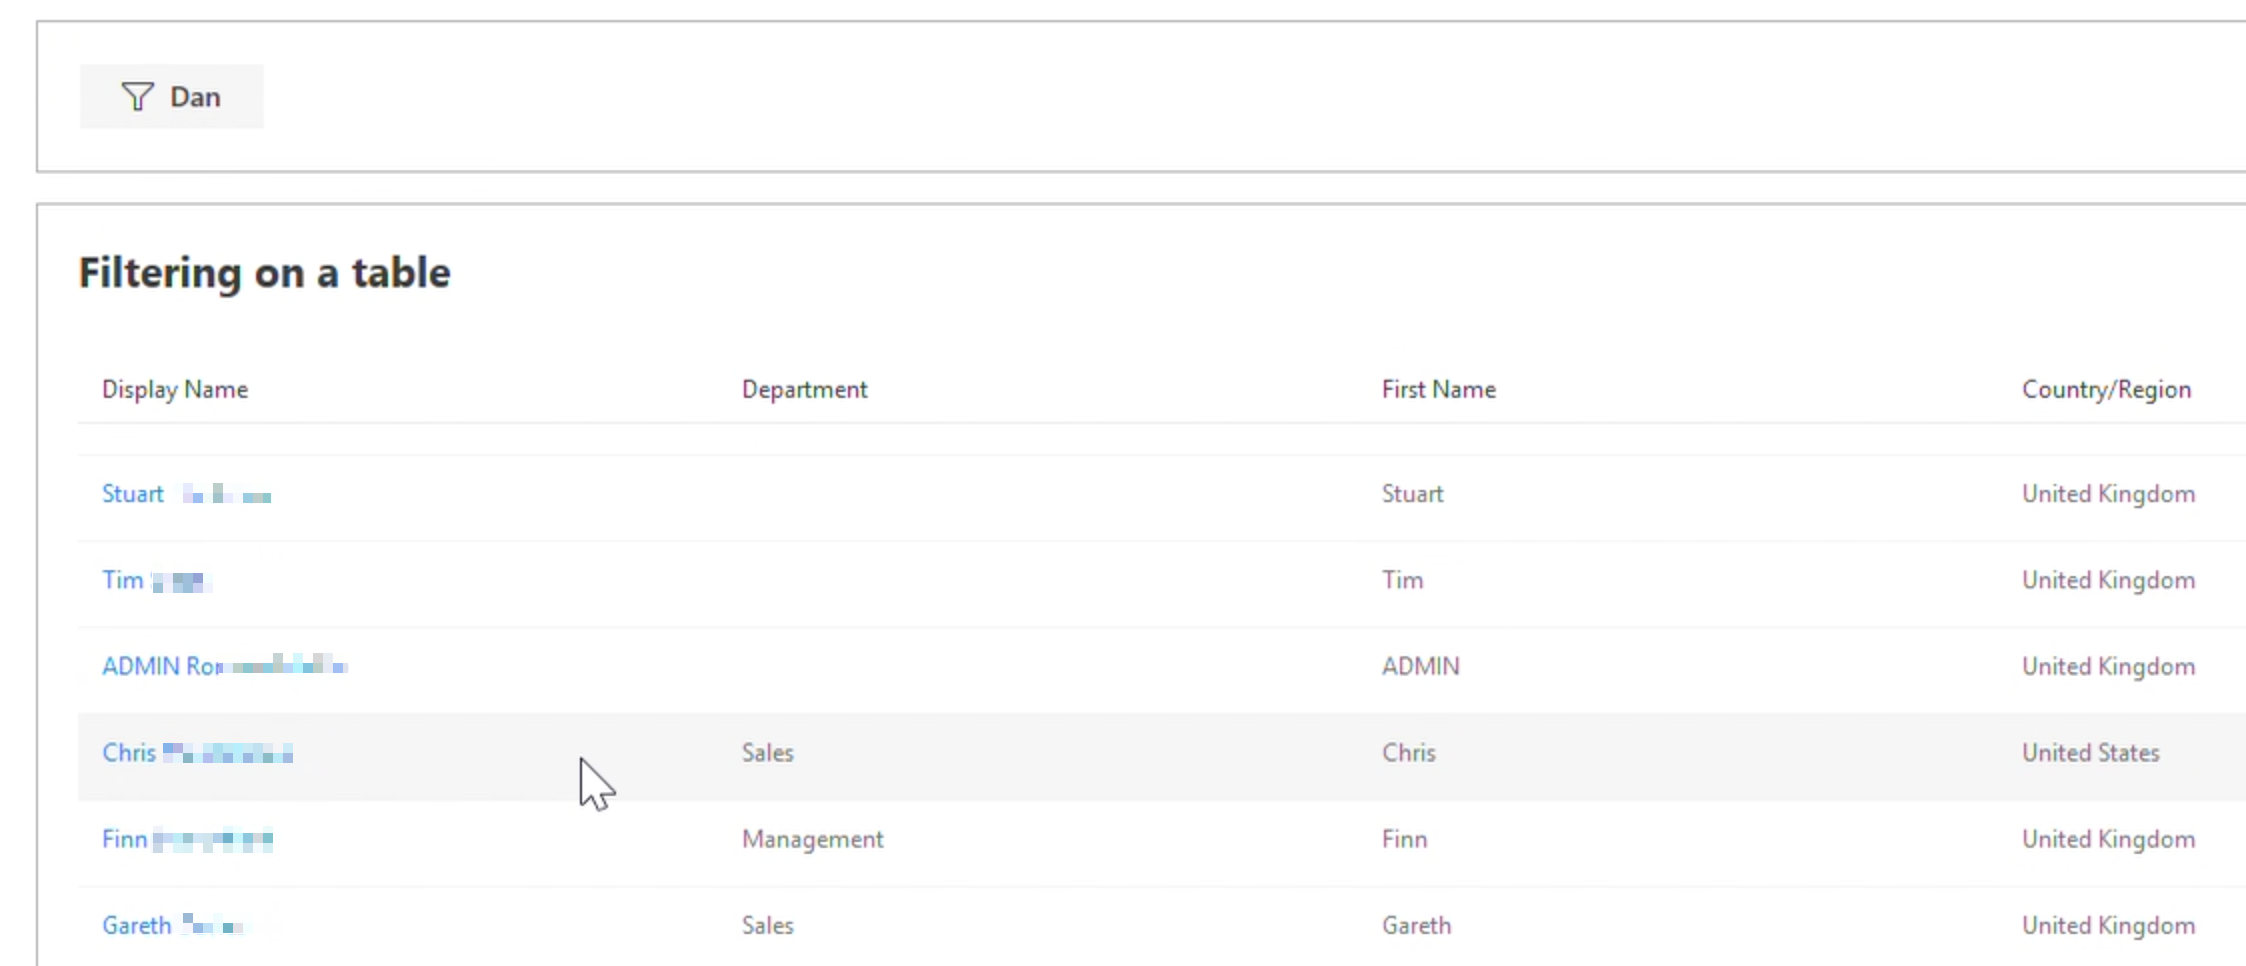
Now at the top of the report you will see the filter, and it can be applied at any time, and can also be disabled at any time; giving you extra flexibility.
Here is how a simple report might be customized. Not filtered:
Filtered:
Searching/Filtering after creating your report
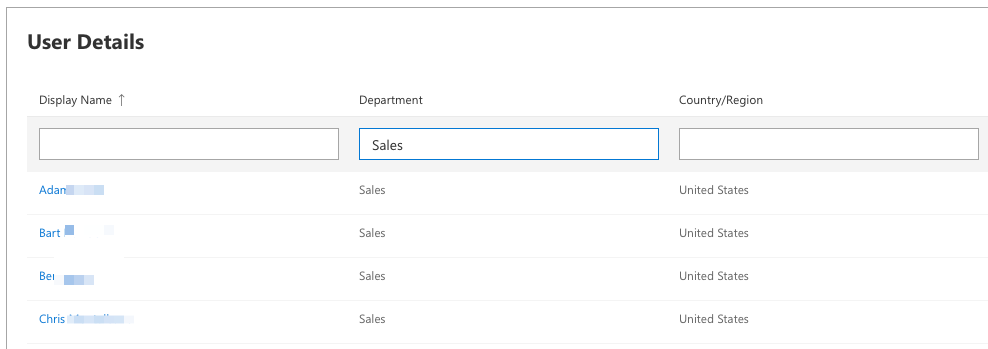
On table data, you will also see filter/search boxes at the top of each column, so, on an existing report, you can quickly filter a working report to show just people in the Sales department for example:
And you can do that on any of the fields, or combine them to give you everyone in Sales in a particular country/region.
Filtering Examples
Check out some examples on how to filter your tables below: