Chatta subito con l'assistenza
Chat con il supporto

Foglight for Infrastructure 5.9.2 - User Guide

Using Foglight for Infrastructure Monitoring log files with Foglight Log Monitor Monitoring IBM PowerVM environments
Before you begin Managing PowerVM HMC agents Monitoring your PowerVM environment
Advanced system configuration and troubleshooting Reference
Advanced System Configuration Foglight for Infrastructure views Foglight Log Monitor views Rules Metrics
Appendix: Building regular expressions in Foglight

Observing alarms

If any alarms are generated against certain types of monitored objects, they appear along the bottom of the summary view on the right. Drill down on an alarm to find out what triggered it. The information appearing in the alarm dialog box can help you understand the cause of the problem, and suggest the steps you can take to further investigate the related issue.

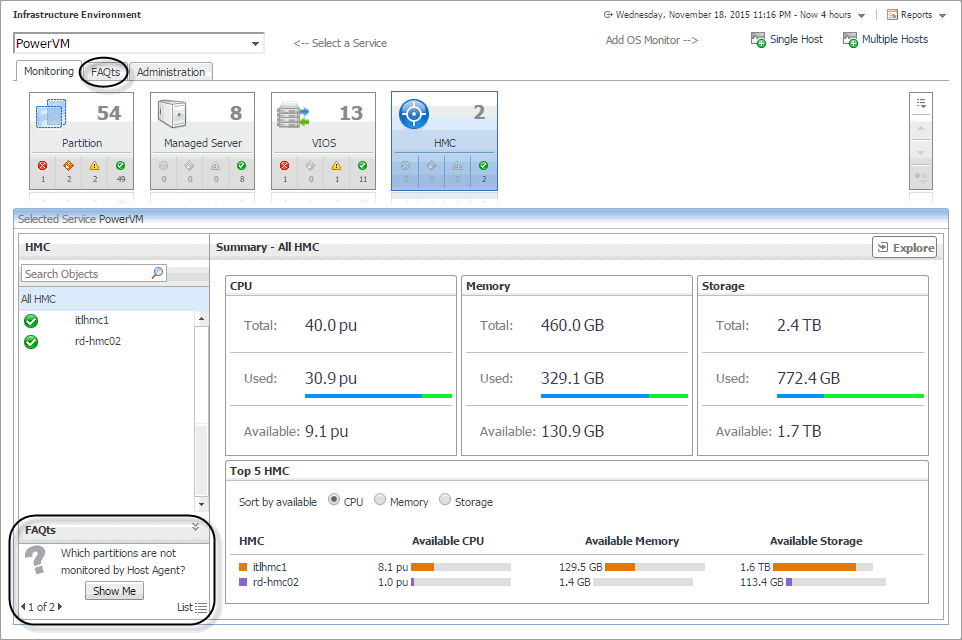
Reviewing FAQts

The bottom-left corner of the Monitoring tab allows you to navigate through commonly asked questions associated with the selected object type, and to review their answers. You can also review these questions using the FAQts tab. For more information, see Reviewing frequently asked questions.

Figure 16. FAQts view

Investigating the collective use of all HMC resources

Your monitored PowerVM® servers are managed by the one or a pair of HMCs (Hardware Management Console). You can monitor the performance of HMC instances when you select the HMC tile on the Infrastructure Environment dashboard.

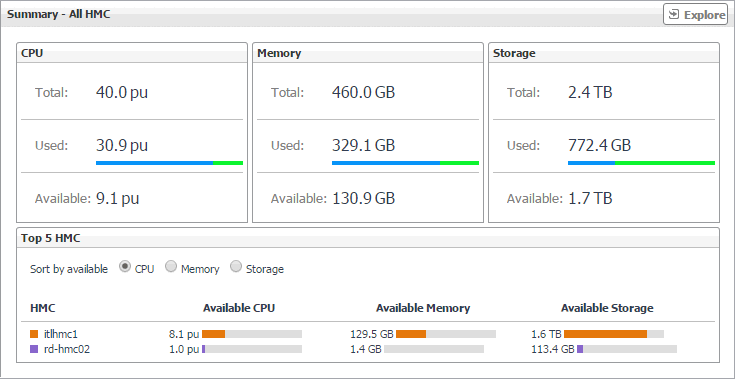
The Summary - All HMC view displays the levels of total, used, and available processor, memory, and disk resources for all HMCs in your integrated infrastructure. This view appears in the Selected Service PowerVM view when you select All HMCs in the HMC view on the left. It identifies the elements with the highest available levels of these resources.

Figure 17. Summary - All HMC view

Table 1. Summary - All HMC view

Total

The total number of processing units that are allocated to all managed servers belonging to all HMC instances in your monitored environment.

Used

The number of processing units that are allocated to all managed servers belonging to all HMC instances in your monitored environment, that are currently in use.

Available

The number of processing units that are allocated to all managed servers belonging to all HMC instances in your monitored environment, that are currently available for use.

Total

The total amount of memory in GB that is allocated to all managed servers belonging to all HMC instances in your monitored environment.

Used

The amount of memory in GB that is allocated to all managed servers belonging to all HMC instances in your monitored environment, that is currently in use.

Available

The amount of memory in GB that is allocated to all managed servers belonging to all HMC instances in your monitored environment, that is currently available for use.

Total

The total amount of disk storage in GB that is allocated to all managed servers belonging to all HMC instances in your monitored environment.

Used

The amount of disk storage in GB that is allocated to all managed servers belonging to all HMC instances in your monitored environment, that is currently in use.

Available

The amount of disk storage in GB that is allocated to all managed servers belonging to all HMC instances in your monitored environment, that is currently available for use.

The HMC instances that consume the highest amounts of processor, memory, and disk resources.

Sort by available

Select processor, Memory, or Storage, to sort the list.

HMC

The name of the HMC instance.

Available CPU

The number of processing units that are allocated to all managed servers belonging to the HMC instance, that are currently available for use.

Available Memory

The amount of memory in GB that is allocated to all managed servers belonging to the HMC instance, that is currently available for use.

The amount of disk storage in GB that is allocated to all managed servers belonging to the HMC instance, that is currently available for use.

Viewing HMC details

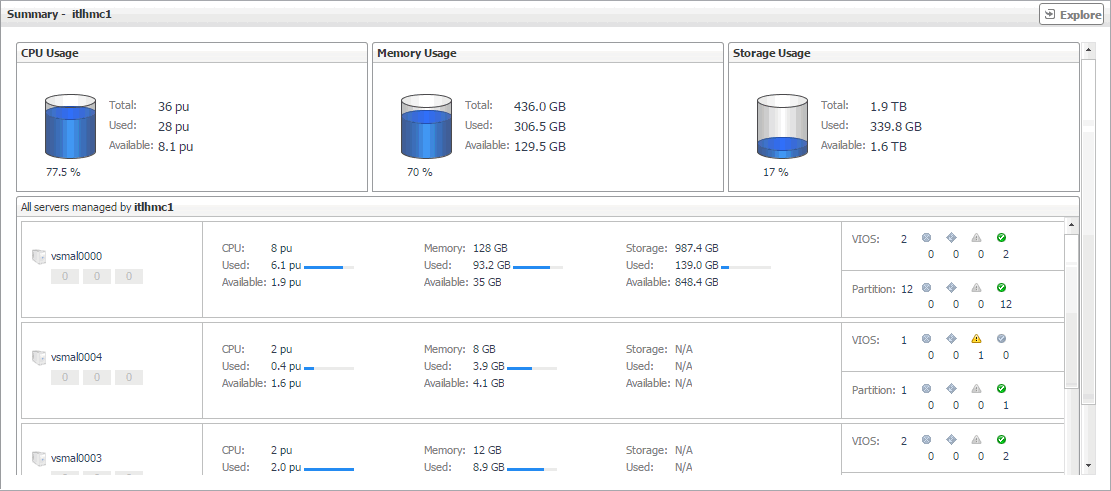
The HMC Summary view displays the resource utilization for all managed servers associated with the selected HMC instance. This view shows the levels of processor, memory, and disk usage for the selected HMC. The view appears in the Selected Service PowerVM view when you select the HMC tile, and then click an HMC instance in the HMC view.

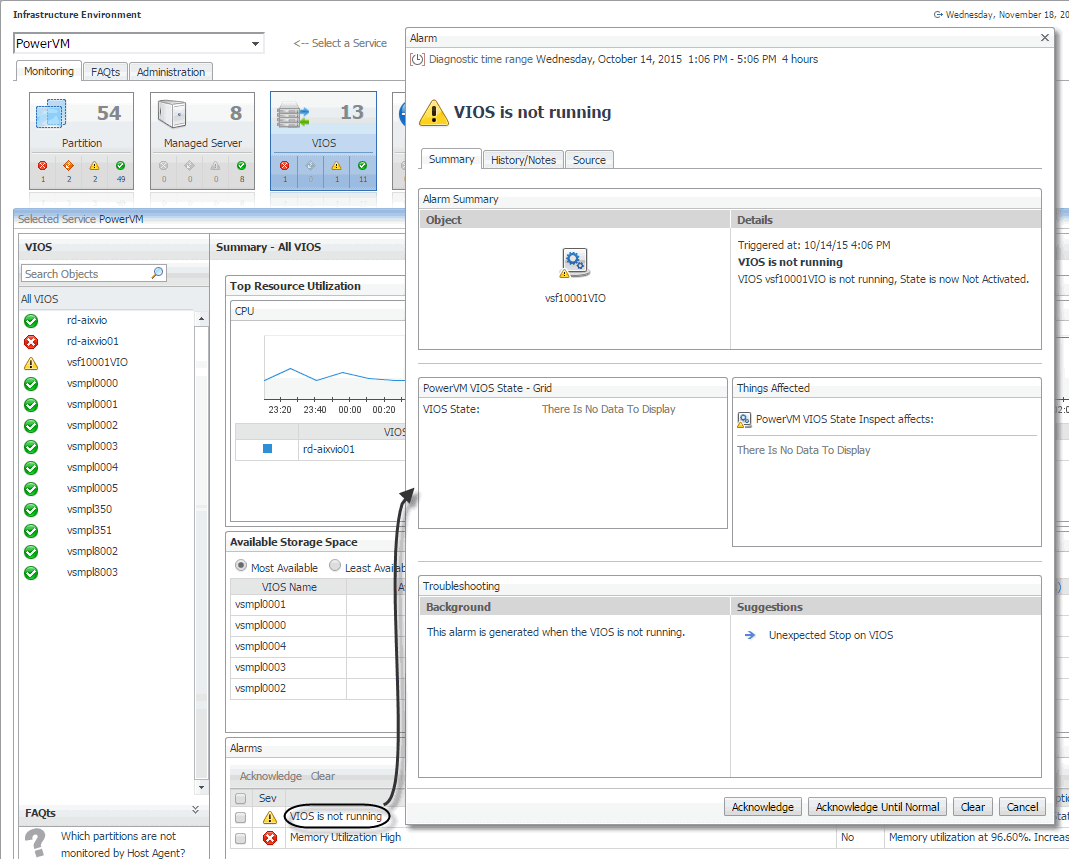
Table 2. HMC view


Total

The total number of processing units that are allocated to all managed servers belonging to the selected HMC.


Used

The number of processing units that are allocated to all managed servers belonging to the selected HMC, that are currently in use.


Available

The number of processing units that are allocated to all managed servers belonging to the selected HMC, that are currently available for use.


Usage percentage

The percentage of processor resources that are allocated to all managed servers belonging to the selected HMC, that are currently in use.


Total

The total amount of memory, in GB, that is allocated to all managed servers belonging to the selected HMC.


Used

The amount of memory, in GB, that is allocated to all managed servers belonging to the selected HMC, that is currently in use.


Available

The amount of memory, in GB, that is allocated to all managed servers belonging to the selected HMC, that is currently available for use.


Usage percentage

The percentage of memory resources that is allocated to all managed servers belonging to the selected HMC, that is currently in use.


Total

The total amount of disk storage, in GB, that is allocated to all managed servers belonging to the selected HMC.


Used

The amount of disk storage, in GB, that is allocated to all managed servers belonging to the selected HMC, that is currently in use.


Available

The amount of disk storage, in GB, that is allocated to all managed servers belonging to the selected HMC, that is currently available for use.


Usage percentage

The percentage of disk storage resources that is allocated to all managed servers belonging to the selected HMC, that is currently in use.


Managed server

The name of the managed server.


Alarm counts

The counts of alarms generated against the managed server, given for each severity state: Warning, Critical, and Fatal.


CPU


Used

The number of processing units that are allocated to the managed server, and are currently in use.


Available

The number of processing units that are allocated to the managed server, and are currently available for use.


Memory


Used

The amount of memory in GB that is allocated to the managed server, and is currently in use.


Available

The amount of memory in GB that is allocated to the managed server, and is currently available for use.


Storage


Used

The amount of disk space in GB that is allocated to the managed server, and is currently in use.


Available

The amount of disk space in GB that is allocated to the managed server, and is currently available for use.


Count

The number of PowerVM virtual I/O servers that manage the use of the managed server’s resources by PowerVM partitions.


Alarm counts

The counts of alarms generated against the associated VIOS instances, given for each severity state: Warning, Critical, and Fatal.


Count

The number of PowerVM partitions that use the managed server’s resources.


Alarm counts

The counts of alarms generated against the associated PowerVM partitions, given for each severity state: Warning, Critical, and Fatal.

Related Documents

The document was helpful.

Seleziona valutazione

I easily found the information I needed.

Seleziona valutazione