Accessing the Infrastructure dashboard
|
• |
On the navigation panel, under Dashboards, click Infrastructure. |
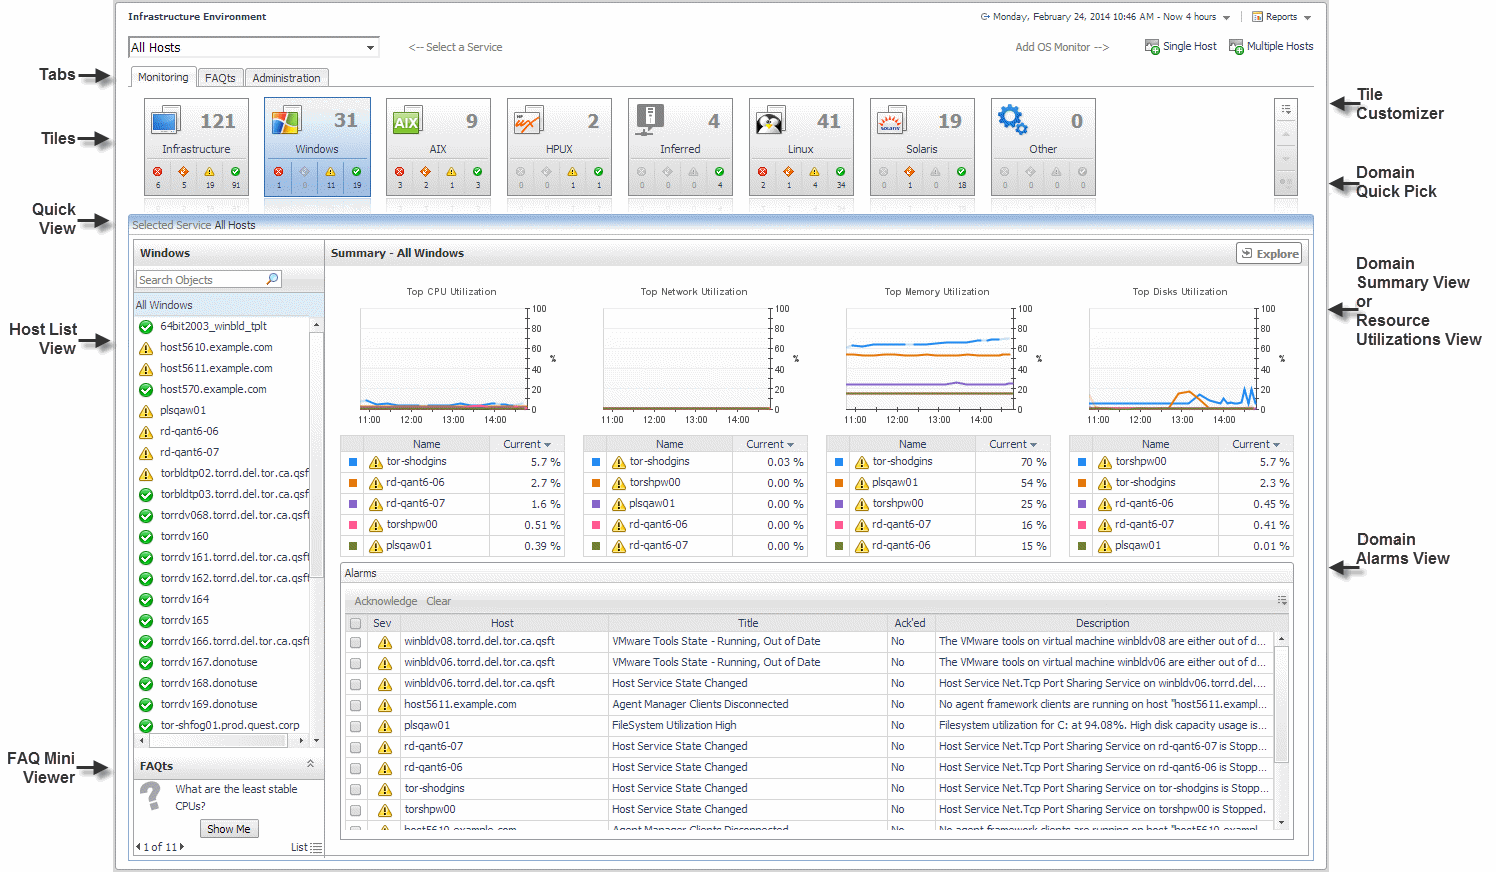
The dashboard contains the following components:
|
• |
Select a Service drop-down list: allows you to select the service that you want to monitor. For more information, see Selecting a service. |
|
• |
Reports button |
|
• |
Add OS Monitor: provides access to the Add Monitored Host and Add Monitored Host - List wizards. For more information about these wizards, see Adding a monitored host and Adding multiple monitored hosts. |
|
NOTE: If Foglight for SNMP is installed on your server, the SNMP Hosts button appears in the Add OS Monitor section. For more information about this functionality, see the Foglight for SNMP product documentation. |
|
• |
Monitoring tab: displays the domains associated with the selected service; allows you to monitor the objects associated with these domains. For more information, see Exploring the Monitoring tab. |
|
• |
FAQts tab (FAQ Question Viewer): displays a list of questions that helps you investigate performance problems with the objects defined in the selected service/domain. For more information, see Exploring the FAQ Question Viewer. |
|
• |
Administration tab: allows you to edit the agent properties for a selected agent or agents. For more information, see Exploring the Administration tab. |
Selecting a service
|
1 |
|
NOTE: For detailed information about monitoring PowerVM services, see the Monitoring IBM PowerVM environments. |
Running a report for the Infrastructure Environment
|
1 |
|
2 |
On the list that appears, click Hosts. This is the report associated with the Infrastructure Environment dashboard. |
|
3 |
On the Set Input Parameters page, select the input parameters for the report from the Time Range and the Service lists, then click Next. |
|
5 |
On the Select Schedule page, select a schedule type from the list of available options, or click New Schedule to define a custom schedule, then click Next. |

