Chatta subito con l'assistenza
Chat con il supporto

Foglight for VMware 5.8.2 - User and Reference Guide

Using Foglight for VMware
Introducing the virtual infrastructure Navigation basics Interacting with Foglight for VMware VMware Performance Agent configuration
Reference
Views
VMware Alarms views VMware Explorer views VMware Modeler views VMware VirtualCenter views VMware Environment views Other views
Rules
Agent Rules Cluster Rules Datacenter Rules Datastore Rules Resource Pool Rules ESX Server Rules VirtualCenter Rules Virtual Machine Rules VMW Stale Data Management Rule Virtual Switch Rules
Appendix: Alarm Messages Appendix: Metrics

VMware Environment views

VMware Environment views

The VMware Environment dashboard contains the following views:

Agents view

This view displays a list of the existing VMware Performance Agent instances and shows their status. Use it to verify that your agents are collecting data from the monitored environment.

Figure 88. Agents view

The Agents view appears at the bottom of the Administration tab.
Active. Indicates if the VMware Performance Agent process is running.
Agent Name. The name of the VMware Performance Agent instance.
Agent Version. Indicates if the agent is running the latest version of the agent package (), or it needs to be updated ().
Alarms. The total numbers of Warning, Critical, and Fatal alarms.
Data Collection. Indicates if the VMware Performance Agent is collecting data from the monitored environment.
Download Log. Allows you to download the agent log file.
Edit Properties. Allows you to edit the agent’s properties.
Foglight Agent Manager Host. The name of the machine on which the Agent Manager and the VMware Performance Agent process are running.
Metric History. The progress of the import of historical data. Each VMware Performance Agent monitors a single Virtual Center. When you create a VMware Performance Agent instance and the Agent Setup wizard determines that the Virtual Center was not previously monitored by this Foglight instance, it starts importing historical data into Foglight. This data is not immediately available as it takes some time to collect it. This process can import data collected over 30 days or less, depending on the amount of data available in the Virtual Center. This allows you to explore VMware metrics as soon as the data is imported, instead for waiting for the agent to collect some data from the Virtual Center. Historical data is intended for charting, trending, and general presentation purposes. It does not cause any alarms to fire.

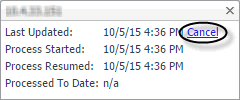
Click this column to start a metric history import, or to see its progress. When the import is in progress, you have an option to cancel it, if needed.

Click Cancel in the dwell to cancel the import. You can resume it at a later time.

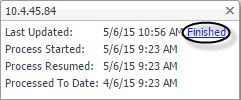
When the metric history import is completed, this is indicated in the dwell.

Alarms view

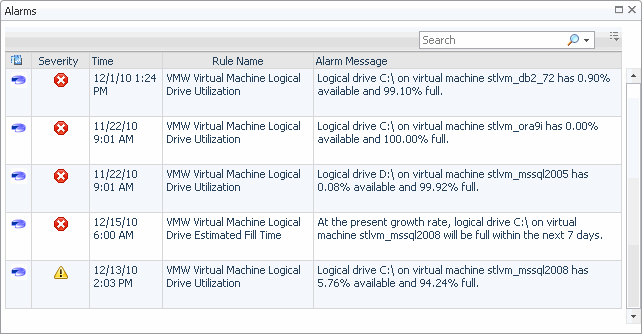
This view displays a list of alarms generated against the objects or group of objects selected in the Quick-View. Use this view to quickly identify any potential problems related to a specific object.

Figure 89. Alarms view

1
On the VMware Environment dashboard, on the Monitoring tab, in the Virtual Environment Overview, select the tile representing the type of the object whose alarms you want to view. For example, to view alarms associated with a specific ESX host, select the ESX Hosts tile.
2
In the Quick-View, in the left pane, expand the Summary node, and select the desired object. The Alarms view appears along the bottom of the Quick-View.
Alarm Message. An explanation about why the alarm occurred.
Severity. The alarm severity icon: Warning, Critical, or Fatal.
Time. The time when the alarm was generated.

Drill down on:

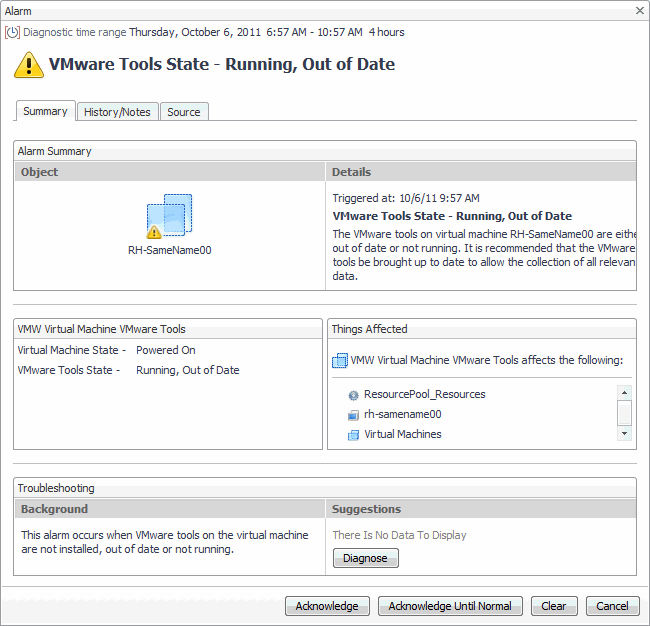
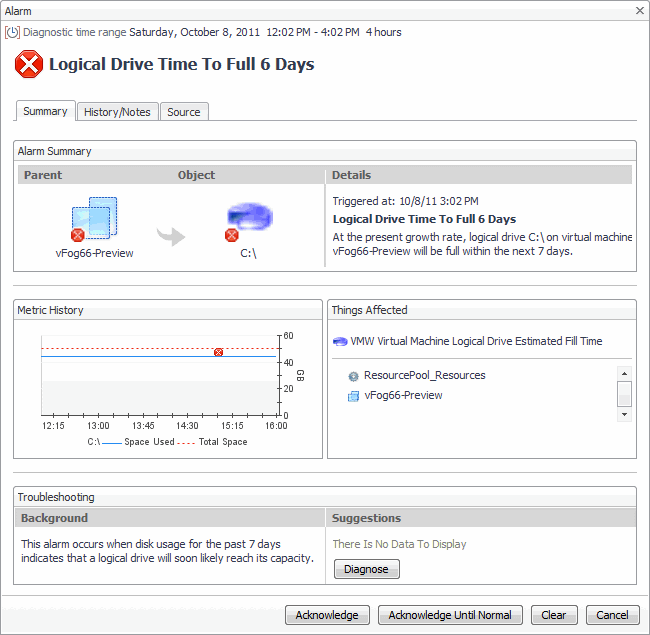
Alarm Message, Severity, or Time. Displays the Alarm dialog box, showing additional information about the alarm. For more information about alarms in Foglight, see the Foglight User Help.

Cluster Summary view

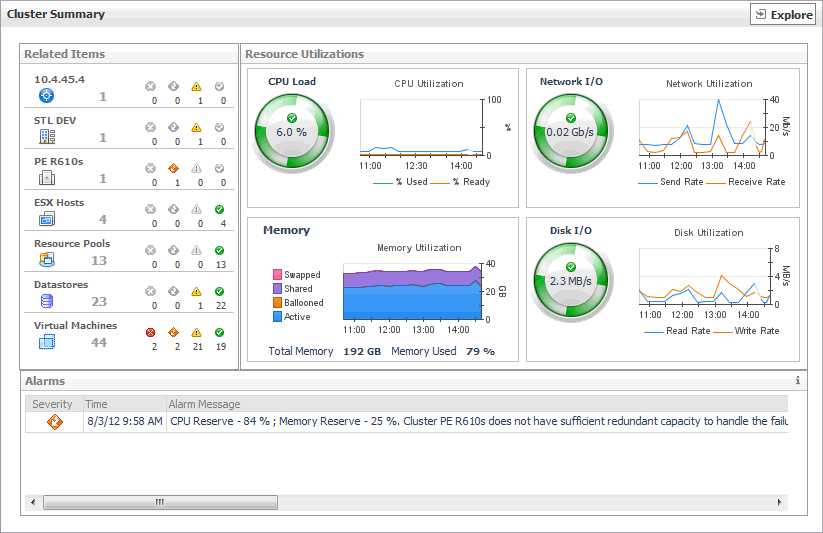
The Cluster Summary view shows the overall resource utilization and the amounts of system resource consumption for an ESX host cluster.

1
On the VMware Environment dashboard, on the Monitoring tab, in the Virtual Environment Overview, select the Clusters tile.
2
In the Quick-View, in the Clusters view, select a cluster node.
The Cluster Summary view appears on the right.

This view is made up of the following embedded views:

Table 101. Alarms

Lists the alarms generated against the selected cluster.

Alarm Message. An explanation about why the alarm occurred.
Severity. Indicates the alarm severity: Warning, Critical, or Fatal.
Time. The time when the alarm was generated.

Drill down on:

Alarm Message, Severity, or Time. Displays the Alarm dialog box, showing additional information about the alarm. For more information about alarms in Foglight, see the Foglight User Help.
Table 102. Related Items

Shows the numbers and states of the cluster, ESX hosts, and virtual machines, all related to the selected cluster.

Cluster. The name of the selected cluster, followed by the related alarm counts.
Datacenter. The name of the datacenter associated with the selected cluster.
Datastores. The number of datastores that are associated with the selected cluster, followed by the related alarm counts.
ESX Hosts. The number of ESX hosts that are associated with the selected cluster, followed by the related alarm counts.
Resource Pools. The number of resource pools that are associated with the selected cluster, followed by the related alarm counts.
Virtual Center. The name of the virtual center associated with the selected cluster, followed by the related alarm counts.
Virtual Machines. The number of virtual machines that are associated with the selected cluster, followed by the related alarm counts.

Drill down on:

Alarm count. Displays the Alarms dialog box that shows a list of all related alarms. For each alarm entry, it shows its severity, the time at which it was triggered, the rule name that triggered the alarm, and the alarm message.
Cluster. Displays the Clusters Inventory dwell, showing the name and state of the selected cluster.
Datacenter. Displays the Datacenters Inventory dwell, showing the names and states of the datacenter associated with the selected cluster.
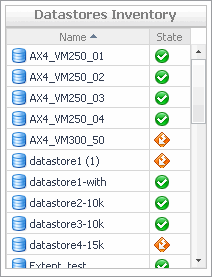
Datastores. Displays the Datastores Inventory dwell, showing the names and states of all datastores that are associated with the selected cluster.
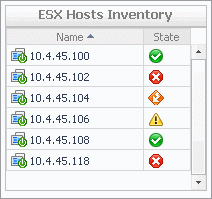
ESX Hosts. Displays the ESX Hosts Inventory dwell, showing the names and states of all ESX hosts that are associated with the selected cluster.
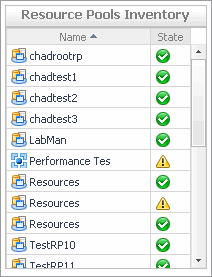
Resource Pools. Displays the Resource Pools Inventory dwell, showing the names and states of all resource pools that are associated with the selected cluster.
Virtual Center. Displays the Virtual Centers Inventory dwell, showing the name and state of the virtual center associated with the selected cluster.
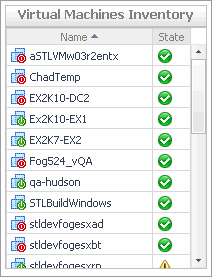
Virtual Machines. Displays the Virtual Machines Inventory dwell, showing the names and states of all virtual machines that are associated with the selected cluster.

Shows the resource consumption for the selected cluster, broken down into four simple views.

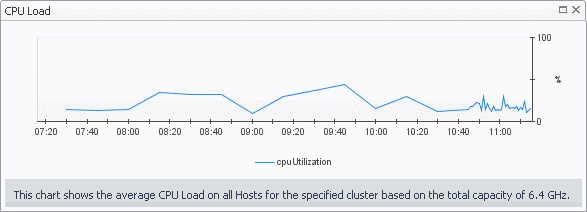
CPU Load. The current percentage of the CPU load, used by the ESX hosts that belong to the selected cluster to execute system code and user programs, based on the combined CPU capacity.
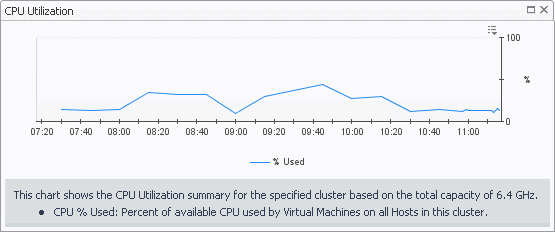
CPU Utilization, % Used. The percentage of the CPU utilization used by the ESX hosts that belong to the selected cluster to execute system code and user programs, during the selected time period.
CPU Utilization, % Ready. The percentage of the cluster’s CPU resources that is ready to execute system code and user programs during the selected time period.
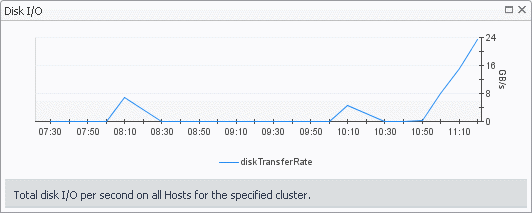
Disk I/O. The current disk I/O rate for all ESX hosts that belong to the selected cluster.
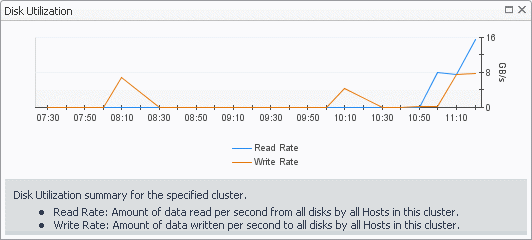
Disk Utilization, Read Rate. The rate at which all ESX hosts that belong to the cluster read data from the disk, during the selected time period.
Disk Utilization, Write Rate. The rate at which data is written to the disks of all ESX hosts that belong to the cluster, during the selected time period.
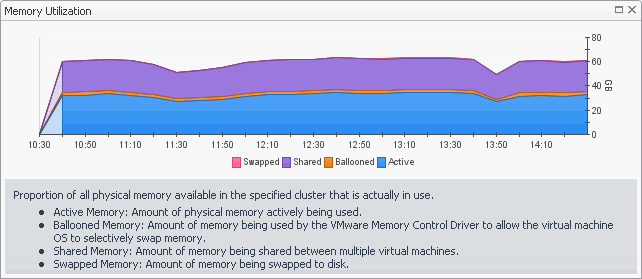
Memory Utilization, Active. The amount of the available memory used by all ESX hosts that belong to the cluster during the selected time period.
Memory Utilization, Ballooned. The amount of physical memory that is actively being used by the VMware Memory Control Driver to allow the guest OS to selectively swap memory.
Memory Utilization, Shared. The amount of the virtual machine memory that is freed up due to transparent page sharing.
Memory Utilization, Swapped. The amount of memory that is stored in disk swap space
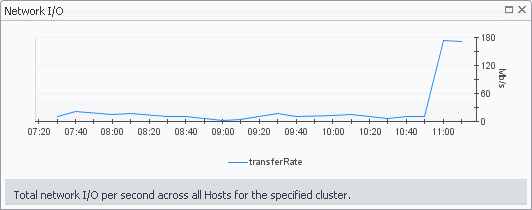
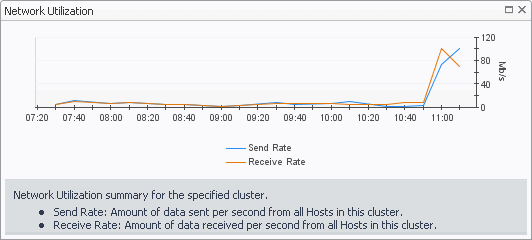
Network I/O. The current rate at which data is transferred from all ESX hosts that belong to the selected cluster to and from the network.
Network Utilization, Receive Rate. The rate at which all ESX hosts that belong to the selected cluster receive data from the network, during the selected time period.
Network Utilization, Send Rate. The rate at which data is transferred from all ESX hosts that belong to the selected cluster to the network, during the selected time period.

Drill down on:

CPU Load spinner. Displays the CPU Load dialog box.
CPU Utilization graph. Displays the CPU Utilization dialog box.
Disk I/O spinner. Displays the Disk I/O dialog box.
Disk Utilization graph. Displays the Disk Utilization dialog box.
Memory Utilization graph. Displays the Memory Utilization dialog box.
Network I/O spinner. Displays the Network I/O dialog box.
Network Utilization graph. Displays the Network Utilization dialog box.
Related Documents

The document was helpful.

Seleziona valutazione

I easily found the information I needed.

Seleziona valutazione