Chatta subito con l'assistenza
Chat con il supporto

Foglight for Infrastructure 5.9.7 - Infrastructure Utilities User Guide

Monitoring Web transactions
Configuring credentials for Web sites requiring user or proxy authentication Exploring your collection of monitored Web sites Investigating the performance of Web transactions and monitoring locations Exploring Web Monitor services Generating reports Configuring Web Monitor agent properties View reference
Monitoring network devices

Monitor tab

The Monitor tab is a container view. It displays a combination of location or transaction information, depending on your selection in the Web Monitor Environment view and the Quick View. Use it to understand the level of user experience offered by the monitored Web sites, and to investigate any issues that they may be experiencing.
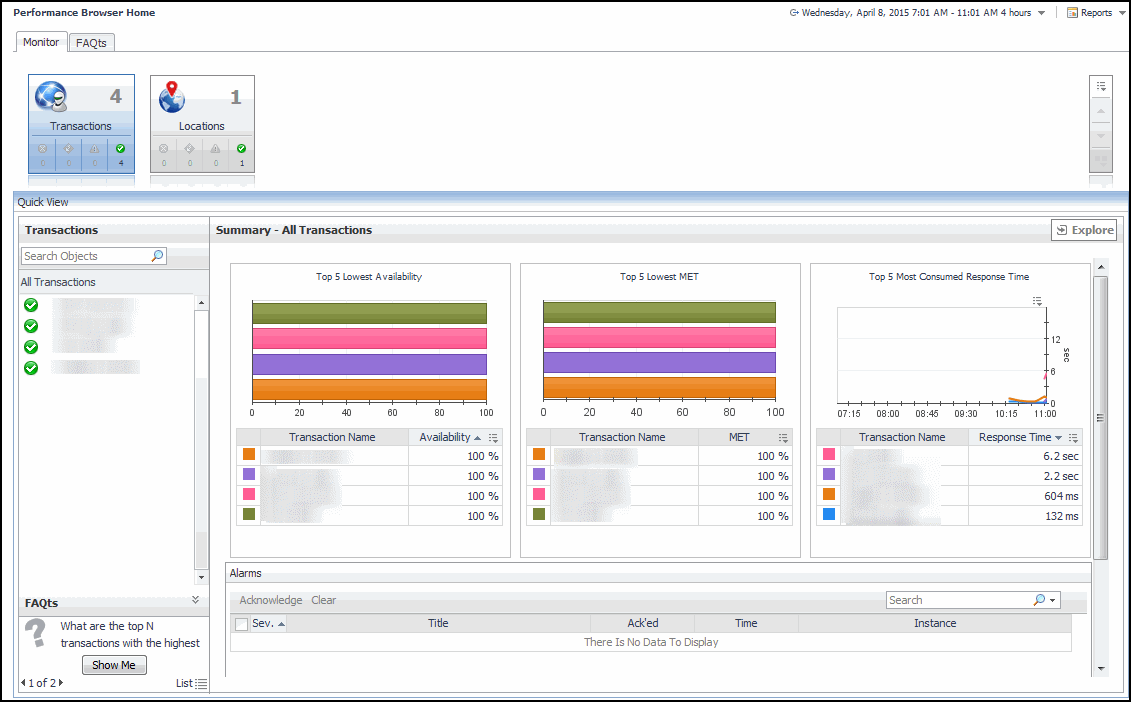
The Monitor tab appears open.

This view is made up of the following views:

Quick View

The Quick View is a container view. It contains a combination of location or transaction views, depending on your selection in the Web Monitor Environment view and the pane on the left. Use it to understand the level of user experience offered by the monitored Web sites, and to investigate any issues that they may be experiencing.
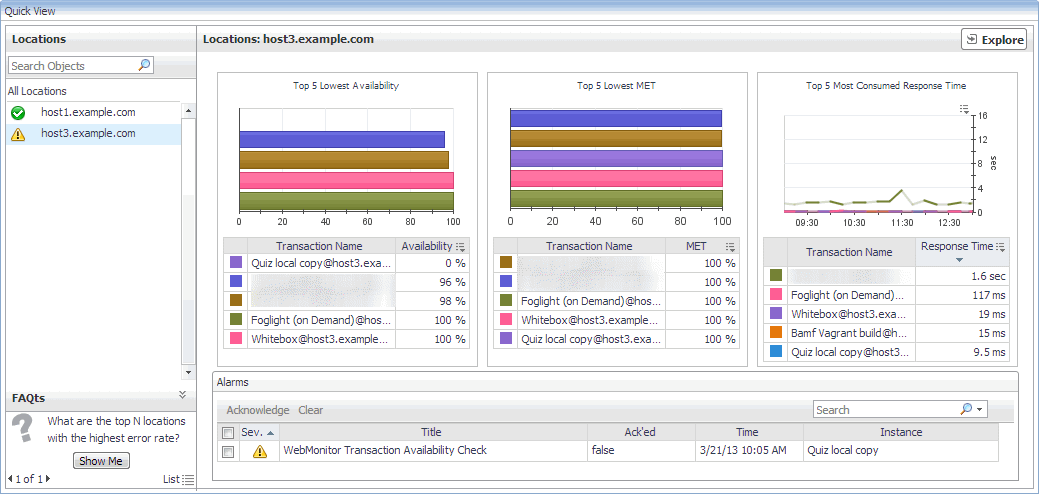
This view appears in the Performance Browser, just below the Web Monitor Environment view.

This view contains a combination of some of the following views, depending on your previous selections:

Summary - All Locations view

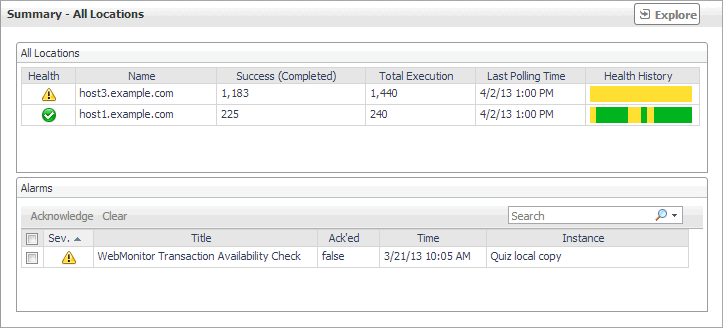
The Summary - All Locations view displays a list of existing locations, and shows any alarms generated against them.
2
On the Monitor tab, in the Web Monitor Environment view, select the Locations tile.
3
In the Quick View, in the embedded Locations view, click All Locations.
The Summary - All Locations view appears on the right.

This view is made up of the following embedded views:

Table 10. Alarms view

Lists the alarms generated against the monitored locations.

NOTE: To acknowledge or clear one or more alarms appearing in this table, select them and click Acknowledge or Clear, as required. For more information about alarms in Foglight, see the Foglight User Guide.
Ack’ed. Indicates if the alarm is acknowledged: true or false.
Instance. The name of the transaction against which the alarm is generated.
Severity. Indicates the alarm severity: Warning , Critical , or Fatal .
Time. The time at which the alarm is generated.
Title. The name of the rule that generated the alarm.

Drill down on:

Any row in this table. Displays the Alarm dialog box, showing additional information about the alarm. For more information about alarms in Foglight, see the Foglight User Help.

Shows a list of all hosts from which Web Monitor Agent instances are running and the related statistics.

Health. The highest severity alarms generated against this Web site: Normal , Warning , Critical , or Fatal .
Name. The name of the host on which the Web Monitor Agent instance is running.
Success (Completed). The number of successful executions the Web Monitor Agent performed since it started collecting data.
Total Execution. The number of execution attempts the Web Monitor Agent performed during the selected time range.
Last Polling Time. The most recent date and time the Web Monitor Agent made an attempt to collect data.
Health History (Rolled Up). A color-coded bar, representing the alarm state of the Web Monitor Agent running on this host over the selected time range. The color of the bar changes depending on the alarm state. Red indicates a Fatal state, orange indicates Critical, yellow means Warning, and green is the Normal State.

Drill down on:

Summary - All Transactions view

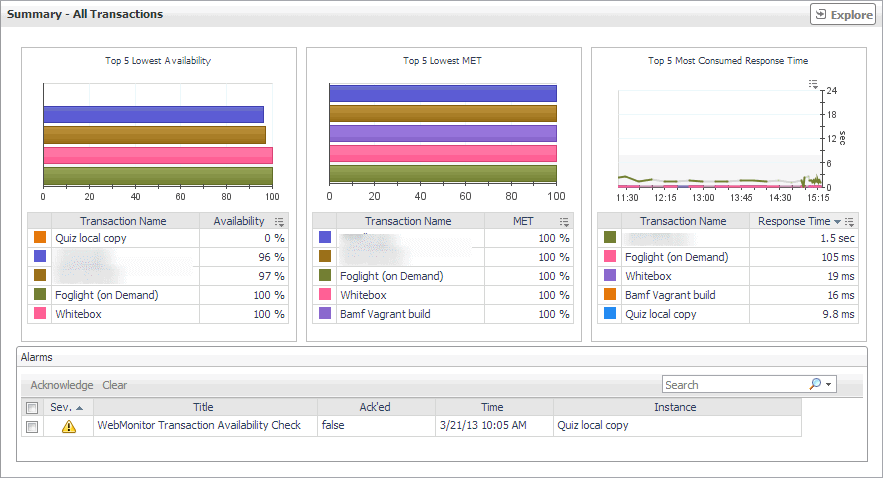
The Summary - All Transaction view displays overall response and availability information for the monitored transactions. It also identifies the transactions with the lowest availability, lowest MET (met expected time), and highest response time, showing the top five transactions in each of these categories.
2
On the Monitor tab, in the Web Monitor Environment view, select the Locations tile.
3
In the Quick View, in the Transaction view, click All Transactions.
The Summary - All Transactions view appears on the right.

This view is made up of the following embedded views:

Table 12. Alarms view

Lists the alarms generated against the monitored transactions.

NOTE: To acknowledge or clear one or more alarms appearing in this table, select them and click Acknowledge or Clear, as required. For more information about alarms in Foglight, see the Foglight User Guide.
Ack’ed. Indicates if the alarm is acknowledged: true or false.
Instance. The name of the transaction against which the alarm is generated.
Severity. Indicates the alarm severity: Warning , Critical , or Fatal .
Time. The time at which the alarm is generated.
Title. The name of the rule that generated the alarm.

Drill down on:

Any row in this table. Displays the Alarm dialog box, showing additional information about the alarm. For more information about alarms in Foglight, see the Foglight User Help.

Shows the top five transactions with the lowest availability.

Availability. The percentage of times the Web site was available when the Web Monitor Agent attempted to collect information from it.
Transaction Name. The transaction name, associated with the monitored URL.

Drill down on:

Shows the top five transactions with the lowest MET.

MET. The percentage of times the Web site meets its acceptable response times, expected by the end user.
Transaction Name. The transaction name, associated with the monitored URL.

Drill down on:

Shows the top five transactions with the highest response time.

Response Time. The amount of time the Web site takes to respond to the Web Monitor Agent request.
Transaction Name. The transaction name, associated with the monitored URL.

Drill down on:

Related Documents

The document was helpful.

Seleziona valutazione

I easily found the information I needed.

Seleziona valutazione