Exchange Explorer dashboard
The Exchange Explorer dashboard contains the following views:
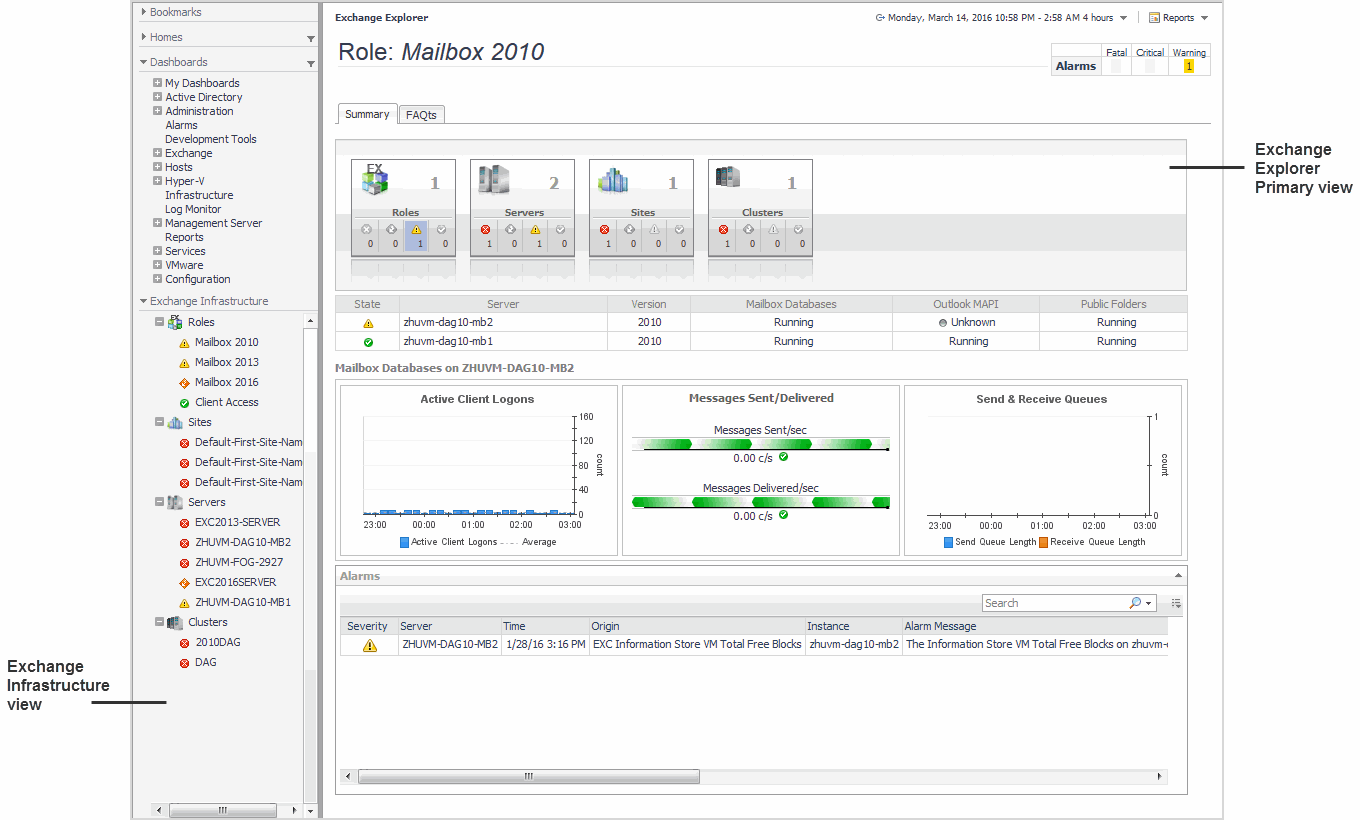
Exchange Infrastructure view
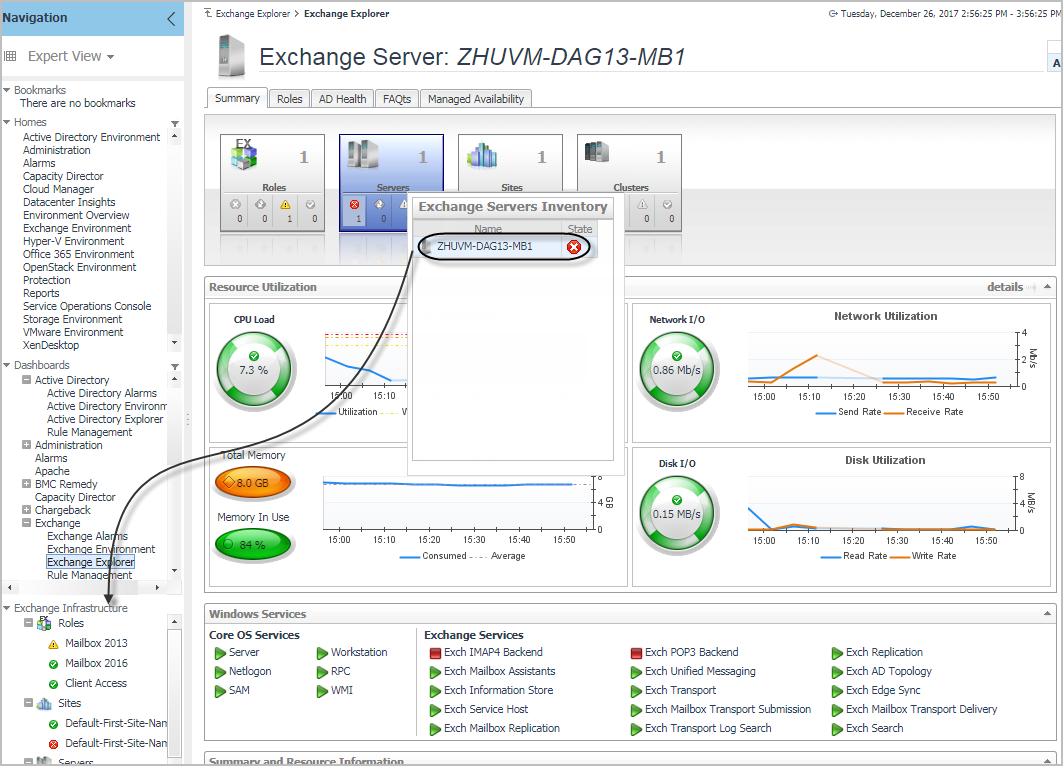
After choosing an object from the Exchange Servers Inventory tile, the Exchange Infrastructure view appears in the navigation panel, under the Dashboards list. It provides an organized view of the Exchange objects that are monitored by Foglight for Exchange.
The Exchange Infrastructure view is organized into a tree using object type containers for branches. The top-level containers are the main Exchange object types (that is, Roles, Sites, Servers, and Clusters) and each object type container contains every object of that particular type that is managed by Foglight for Exchange. Click the expansion state box to the left of a container to expand the view to display the individual objects.
Clicking an object type container or object in the Exchange Infrastructure view refreshes all of the views in the Exchange Explorer Primary view to display information pertaining to the selected object.
Exchange Explorer Primary view
| |||||||
| |||||||
| |||||||
| |||||||
|
The Primary view may contain the following embedded views (navigation tabs):
Selecting the Summary navigation tab displays the Summary view just below the heading. This view provides an inventory, in the form of tiles, of the objects that are related to the object or object container selected in the Exchange Infrastructure view. Each tile shows how many objects of the corresponding object type there are, as well as the count of objects of that type in each of the alarm states (fatal, critical, warning, and normal).
When an individual server is selected in the Exchange Infrastructure view, the Roles navigation tab appears. The content of this view is based on the Exchange role selected at the top of the Exchange Server Roles view. By default, each role view displays performance metrics and information for the Exchange roles being performed by the selected Exchange server. Additional metrics can optionally be displayed by enabling the corresponding collection group on the Exchange Metrics Management dashboard.
When an individual server is selected in the Exchange Infrastructure view, the AD Health navigation tab appears. This tab displays the Exchange Server AD Health view, which displays performance metrics about the DCs in your Active Directory® environment.
Selecting the FAQts navigation tab displays a list of all the questions available for all Exchange object types.
When an individual Exchange 2013 or 2016 server is selected in the Exchange Infrastructure view, the Managed Availability navigation tab appears.
The Managed Availability Recovery Action Results view on this tab displays a list of actions that the Managed Availability process triggered to address availability and latency issues or errors, in order to resume the service. For each action, the list displays the time when it was logged. In addition, the Message column contains the description of the recovery action. Click the Probe Results column to review the detected errors that possibly triggered the recovery action.
Exchange Rule Management dashboard
For a description of the Exchange Rule Management dashboard and for more information on the Foglight for Exchange rules and how to enable, disable or modify them, see Foglight for Exchange rules.


