Performance monitoring with the Hyper-V Environment dashboard
Accessing the Hyper-V Environment dashboard
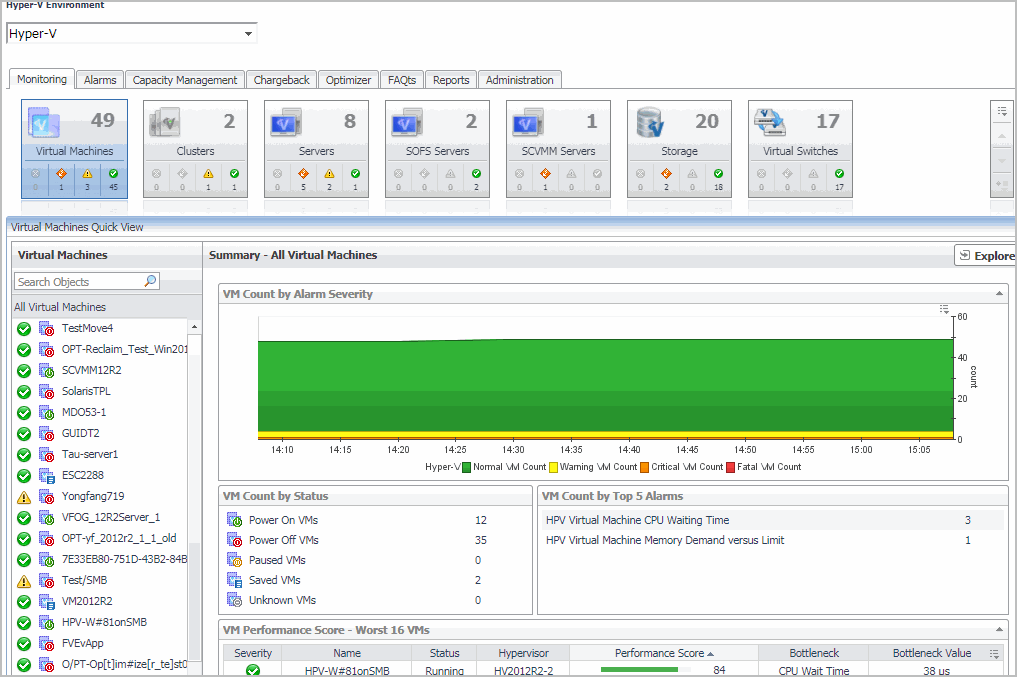
When you navigate to the Hyper-V Environment dashboard for the first time, the Monitoring tab appears. This tab provides an overall summary of your virtual environment.
|
3 |
|
4 |
Select the Clusters, Servers, Virtual Machines, SOFS Servers, SCVMM Servers, Storage, or Virtual Switches tile from the top left. |
Monitoring tab
Gauge charts
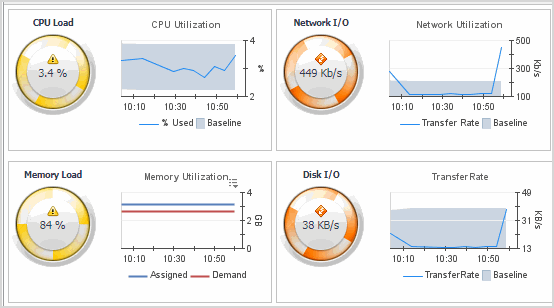
The data of CPU, memory, network, and disk usage are represented using a spinner (also known as rotating wheel) which is divided into four severity levels, including Normal (in green), Warning (in yellow), Critical (in orange), and Fatal (in red).
The severity of CPU Load is calculated based on the following formula: (utilization current average - utilization period average)/utilization period standardDeviation. If this value is:
The severity of Network I/O is calculated based on the following formula: (transferRate current average - transferRate period average)/transferRate period standardDeviation. If this value is:
The severity of Memory Load is calculated based on the following formula: (currentPressure current average - currentPressure period average)/currentPressure period standardDeviation. If this value is:
The severity of Disk usage is calculated based on the following formula: (diskTransferRate current average - diskTransferRate period average)/diskTransferRate period standardDeviation. If this value is:


