Virtual Environment Overview
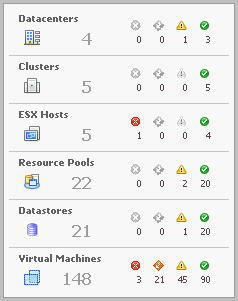
Virtual Environment Summary dashboard provides a Virtual Environment Overview. The Virtual Environment Overview is located at the top of the dashboard. For more information about this dashboard, see Use the VMware View Environment dashboard.
The Virtual Environment Overview provides you with an overview of the selected virtual environment.
If an alarm state has a count of zero, then you cannot select that alarm state.
Virtual Infrastructure view
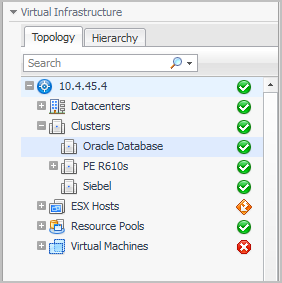
The VMware Explorer dashboard provides a Virtual Infrastructure view. The Virtual Infrastructure view is located in the navigational panel at the left of the Foglight for Hyper-V browser interface, under Dashboards. For more information about the VMware Explorer dashboard, see Use the VMware Explorer.
The Virtual Infrastructure view contains two tabs views: the Topology tab and the Hierarchy tab.
The Virtual Infrastructure view is made up of the following embedded views:
The top-level objects in the Topology view are always the VirtualCenters.
Each object in the Hierarchy view has a representative icon that is displayed at the left of the object’s name. These icons are shown in the table in Topology tab .
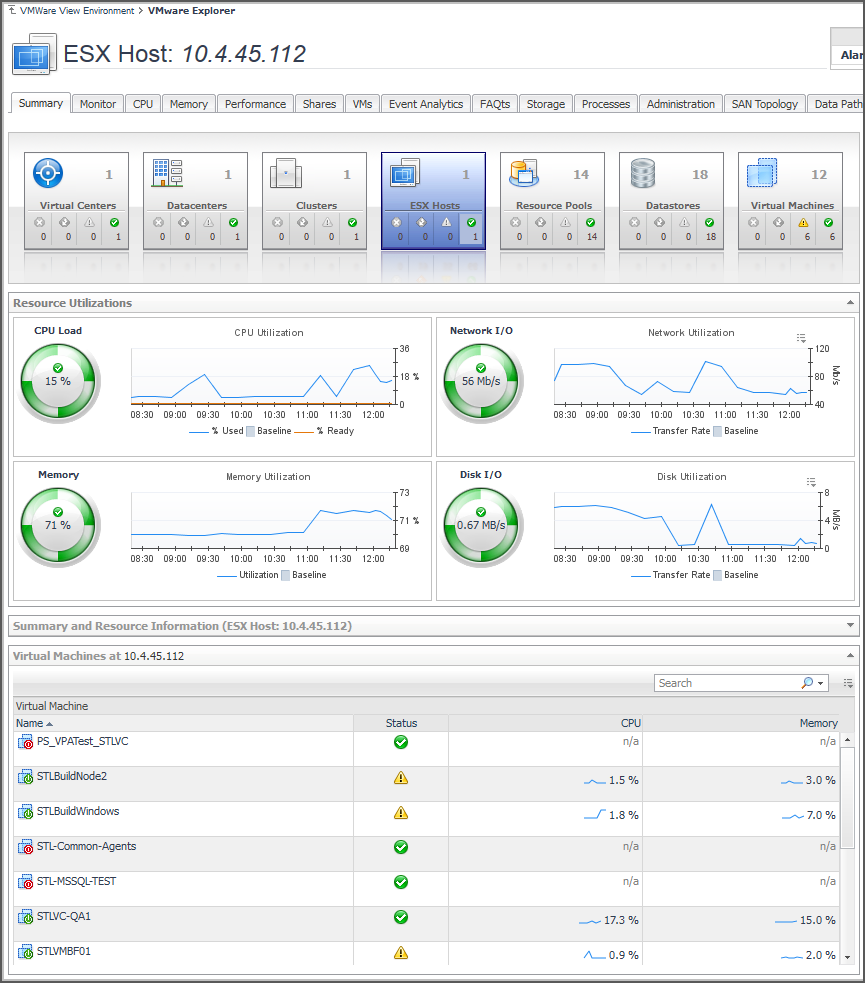
VMware Explorer Primary view
The VMware Explorer dashboard has a Primary view that takes up the entire display panel of the browser interface. For more information about the VMware Explorer dashboard, see Use the VMware Explorer.
|
• |
|
• |
VMs tab
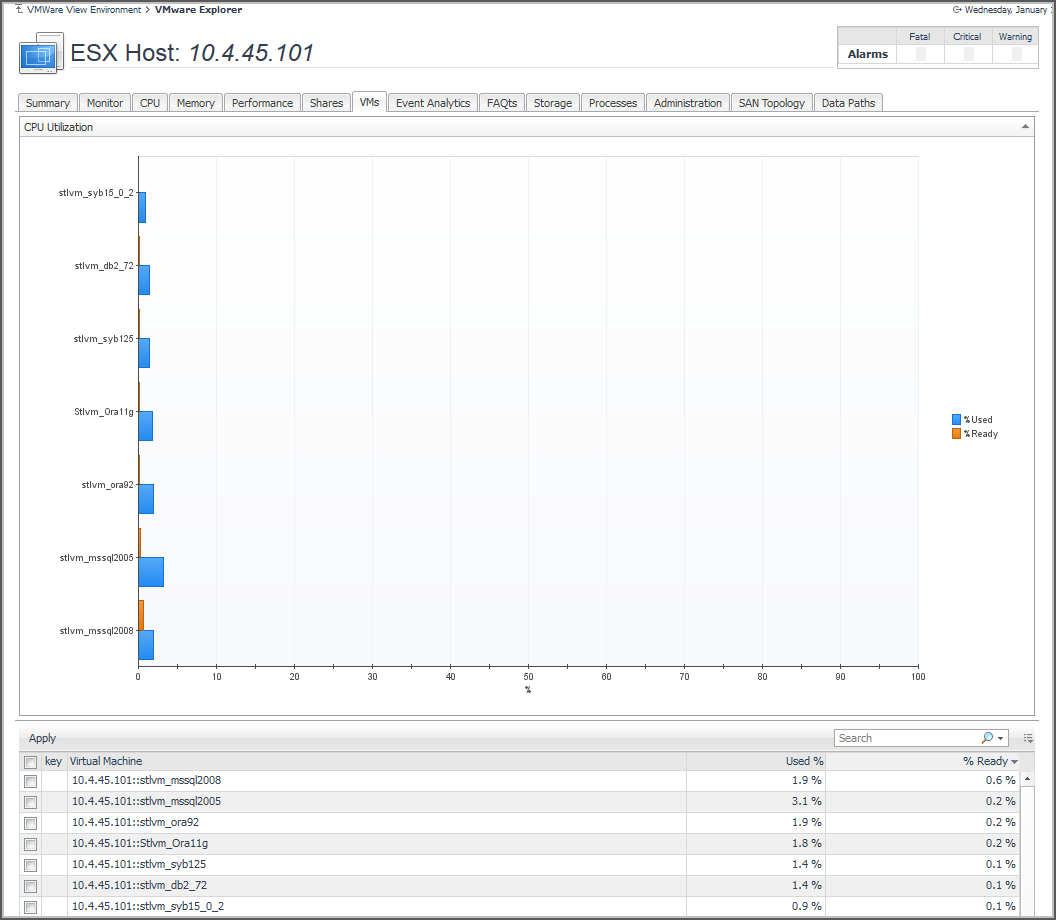
This tab is available in the VMware Explorer. To find it, open the VMware Explorer and on the Virtual Infrastructure view, that appears on the navigation panel, select any node, except the individual virtual machine nodes. In the VMware Explorer, open the VMs tab.
The VMware Explorer’s VMs tab displays the combined CPU utilization for all virtual machines associated with the selected component. This includes the percentages of CPU processing power allocated to the virtual machines that is used and ready for use.


