Chat now with support
Chat with Support

Foglight for VMware Horizon View 5.7.7 - User and Reference Guide

Manage desktops in virtual environments Interact with Foglight for VMware Horizon View dashboards Reference

Virtual Environment Overview

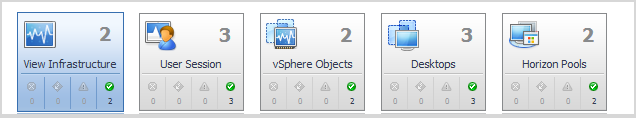
Virtual Environment Summary dashboard provides a Virtual Environment Overview. The Virtual Environment Overview is located at the top of the dashboard. For more information about this dashboard, see Use the VMware View Environment dashboard.

The Virtual Environment Overview provides you with an overview of the selected virtual environment.

The overview has a tile for each type of object in your virtual infrastructure. Each tile shows how many of the corresponding object type there are in your virtual infrastructure, as well as the count of objects of that type in each of the alarm states (normal, warning, critical, fatal).

Click the object type icon, the object type name, or the object count, to view summary information for that entire object type in the Quick-View. Click an alarm state (for example, warning) on a tile to view summary information in the Quick-View for the objects of that type that are in the selected alarm state.

If an alarm state has a count of zero, then you cannot select that alarm state.

Virtual Infrastructure view

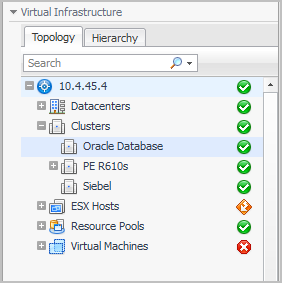
The VMware Explorer dashboard provides a Virtual Infrastructure view. The Virtual Infrastructure view is located in the navigational panel at the left of the Foglight for Hyper-V browser interface, under Dashboards. For more information about the VMware Explorer dashboard, see Use the VMware Explorer.

The Virtual Infrastructure view provides an organized view of the various virtual infrastructure objects that are monitored by agents. It serves as a navigation tool, and it also presents pertinent alarm information.

When you select an object from the Virtual Infrastructure view, all of the views in the VMware Explorer dashboard are updated with information pertaining to that object.

The Virtual Infrastructure view contains two tabs views: the Topology tab and the Hierarchy tab.

Within the Topology view, all of the virtual infrastructure objects are organized into a tree using object type (or topology type) containers for branches. The top-level objects in the Topology view are always the VirtualCenters or vCenter®.

Within the Hierarchy view, each VirtualCenter object is organized into a tree that has the same hierarchical structure as the VirtualCenter and displays the objects (datacenters, clusters, resource pools, virtual machines, folders, etc.) within the VirtualCenter as branches.

The Virtual Infrastructure view is made up of the following embedded views:

The Topology view is organized into a tree using object type (or topology type) containers for branches.

The top-level objects in the Topology view are always the VirtualCenters.

Each VirtualCenter in the Topology view contains several object type containers, and each object type container contains every object of that particular type that is managed by the parent VirtualCenter.

Each object type container, as well as each object, has a representative icon that is displayed to the left, as shown in the following table.

VirtualCenter

VMWVirtualCenter

Datacenter

VMWDatacenter

Cluster

VMWCluster

ESX Server

VMWESXServer

Resource Pool

VMWResourcePool

Virtual Machine

VMWVirtualMachine

Datastore

VMWDatastore

At the right, the Topology view displays status indicators. For an individual object, the status indicator represents the alarm of highest severity that is outstanding for that object. For an object type container, the status indicator represents the alarm of highest severity that is outstanding for all of the objects of that type.

The Hierarchy view represents the logical layout of VirtualCenter management servers, so it is not organized into groups of common objects.

In the Hierarchy view, each VirtualCenter object is organized into a tree that has the same hierarchical structure as the corresponding VirtualCenter, displaying the objects (for example, datacenters, clusters, resource pools, virtual machines, and folders) within the VirtualCenter as branches.

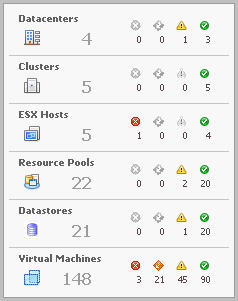
Each object in the Hierarchy view has a representative icon that is displayed at the left of the object’s name. These icons are shown in the table in Topology tab .

At the right, the Hierarchy view displays status indicators. Each status indicator represents the alarm of highest severity that is outstanding for the corresponding object.

When you hover the cursor over an object in the Virtual Infrastructure view, you see a popup that provides a summary of the present state of that object.

The following image shows the popup you see when you hover the cursor over a VirtualCenter object in the Virtual Infrastructure view.

VMware Explorer Primary view

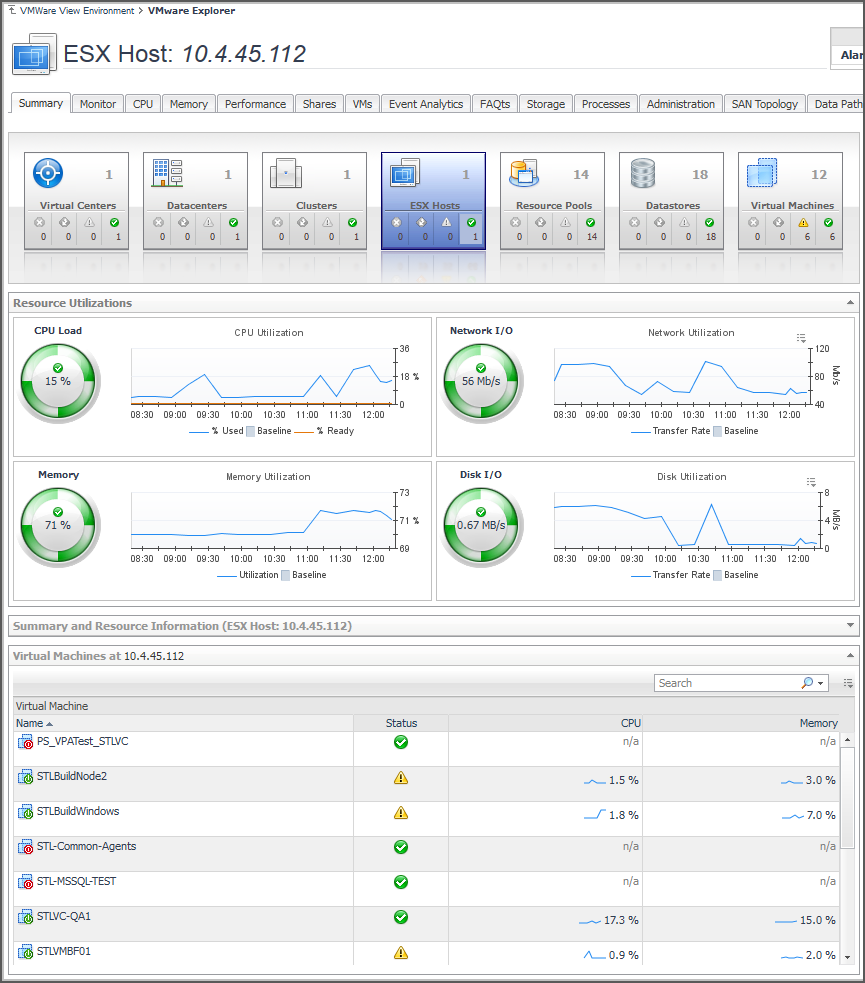
The VMware Explorer dashboard has a Primary view that takes up the entire display panel of the browser interface. For more information about the VMware Explorer dashboard, see Use the VMware Explorer.

The VMware Explorer Primary view is the most content-intensive view in Foglight for VMware Horizon View. It provides access to summary (of alarm, resource, and other) information for the object being viewed in the VMware Explorer dashboard, as well as detailed information on performance with respect to the four core ESX® infrastructure resources: CPU, memory, disk, and network usage. This view provides a great deal of value to administrators who leverage to monitor their virtual infrastructure.

It provides navigation tabs that can be used to view a variety of valuable information pertaining to the object being viewed.

The metrics and the amount of detail displayed in the Primary view vary depending on the type of object you select.

The Primary view changes in appearance and content, depending on which navigation tab and embedded view you have selected.

The VMware Explorer Primary view heading, located at the top of the VMware Explorer Primary view, consists of three main components:

The alarm summary at the right of the Primary view heading shows you the number of alarms at each severity level that are outstanding for the selected object. When you click an alarm count, you get a popup that lists the active alarms for the object.

The navigation tabs are located immediately below the selected object’s name. These navigation tabs vary from object to object, but generally contain a tab to an object summary (typically the default view), a tab to an object performance overview, and one or more tabs to other relevant information.

The Primary view changes in appearance and content, depending on which navigation tab and embedded view you have selected. For example, typically if you select an object type container from the Topology view, the Summary tab in the Primary view displays a consumption graph and a table that are representative of the group of objects within that container. However, if you select a Resource Pools container from the Topology view, the Summary tab in the Primary view displays a Resource Pools Relationship Tree that contains every resource pool that belongs to the clusters within the associated VirtualCenter.

If you select an individual resource pool from the Virtual Infrastructure view, the Summary tab in the Primary view displays summary and utilization information for that resource pool. This is typically the type of information you see for the Summary tab when you select any individual object from the Virtual Infrastructure view.

The metrics and the amount of detail displayed in the Primary view vary depending on the type of object you select.

The VMware Explorer Primary view a combination of a number of different embedded views. For more information, see the following topics:

VMs tab

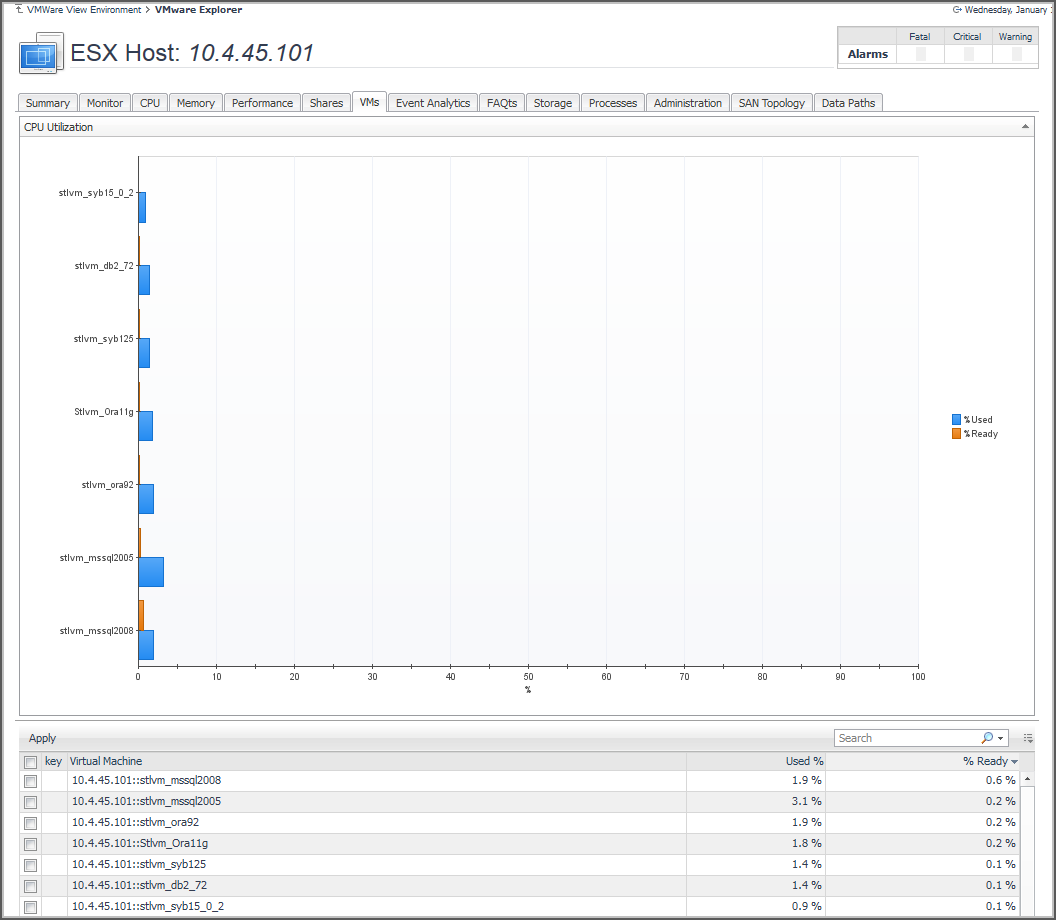
This tab is available in the VMware Explorer. To find it, open the VMware Explorer and on the Virtual Infrastructure view, that appears on the navigation panel, select any node, except the individual virtual machine nodes. In the VMware Explorer, open the VMs tab.

The VMware Explorer’s VMs tab displays the combined CPU utilization for all virtual machines associated with the selected component. This includes the percentages of CPU processing power allocated to the virtual machines that is used and ready for use.

Figure 56. VMs tab

This view is made up of the following embedded views:

This view shows the percentages of CPU processing power that is used and ready for use, for each virtual machine that is associated with the selected component during the selected time period.

This view shows a list of all virtual machines that are associated with the selected component. It displays the names and percentages of CPU processing power that is used and ready for use, for each virtual machine.


Related Documents

The document was helpful.

Select Rating

I easily found the information I needed.

Select Rating