Monitoring vSphere resources
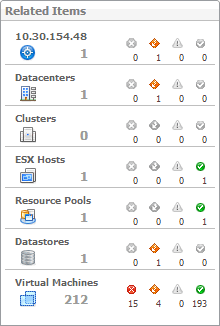
A typical vSphere® infrastructure consists of the following objects:
|
• |
Virtual centers: Software used to manage virtual environments that are built on the VMware® virtualization platform. Each virtual center creates a hierarchical structure of virtual objects that enables a system administrator to logically lay out their virtual infrastructure configuration. |
|
• |
|
• |
Datastores: Storage location for virtual machine files. |
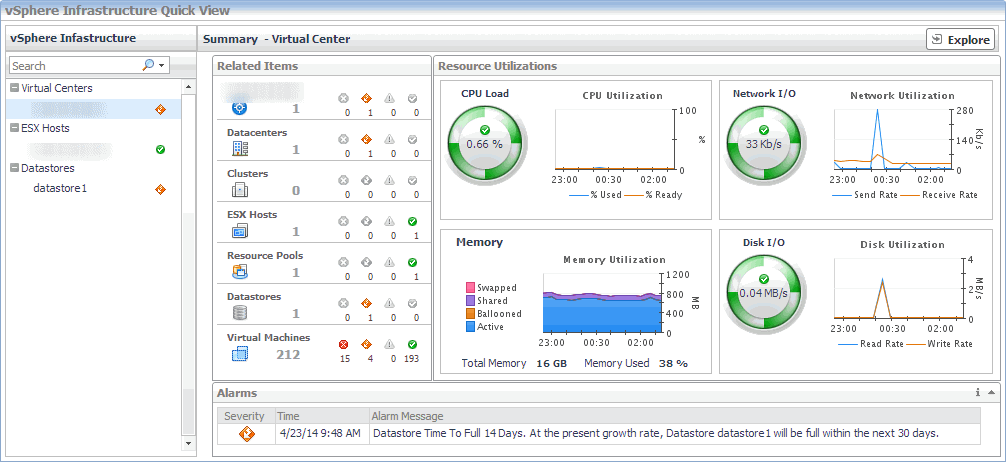
You can monitor the performance of these elements when you select the vSphere tile on the XenDesktop Environment dashboard. The information appearing in the vSphere Infrastructure Quick View can help you discover sources of performance degradation such as spikes in CPU, memory and disk usage, and to reallocate resources where they are most needed.
|
1 |
|
2 |
|
3 |
To display resource utilization statistics for a monitored virtual center or an ESX host, vSphere Infrastructure Quick View, in the vSphere Infrastructure view on the left, click a virtual center node or an ESX host node. |
|
5 |
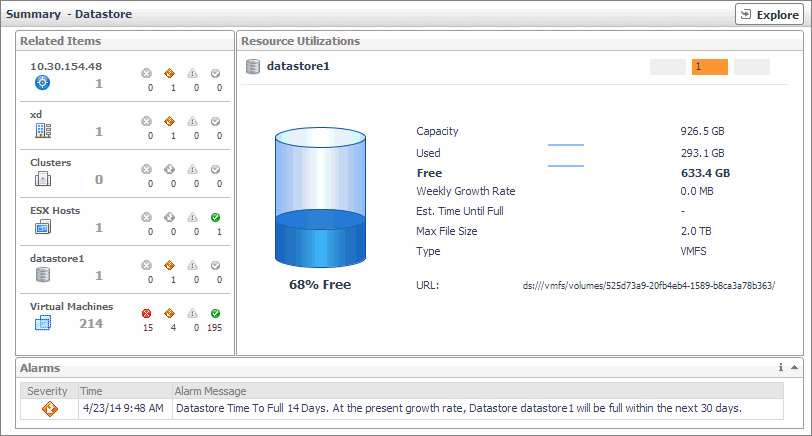
In the vSphere Infrastructure Quick View, in the vSphere Infrastructure view on the left, under Datastores, click a datastore node. |
Investigating the use of Virtual Center and ESX Host resources
A virtual center application creates a hierarchical structure of virtual objects that enables a system administrator to logically lay out their virtual infrastructure configuration. In your monitored virtual center, ESX® hosts are physical machines hosting one or more virtual machines.
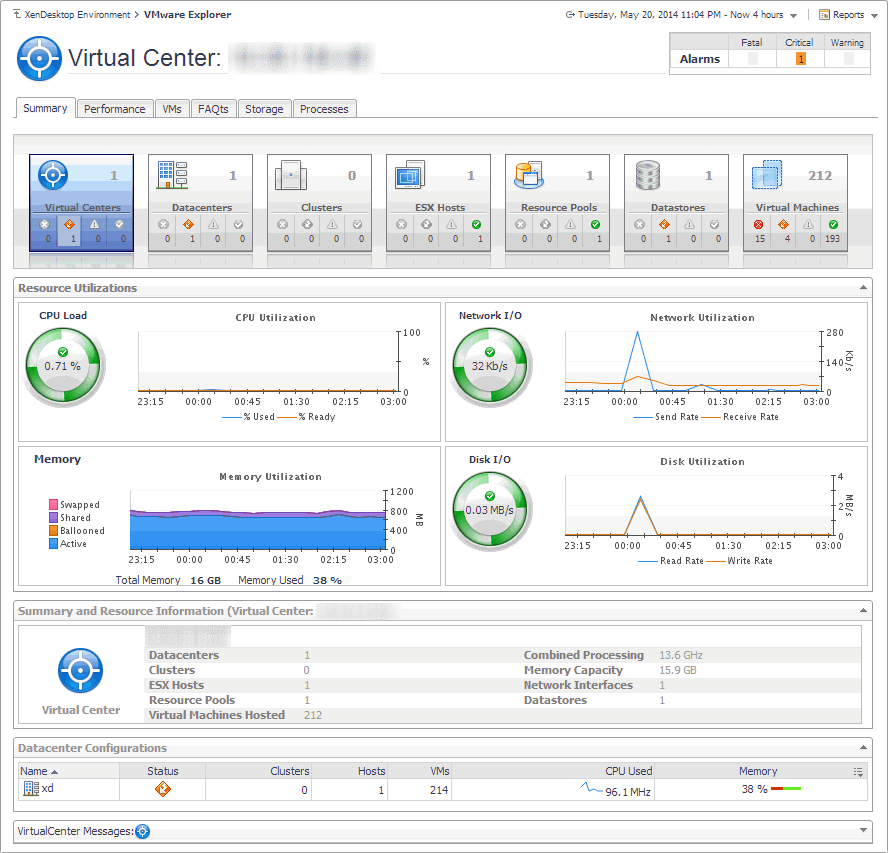
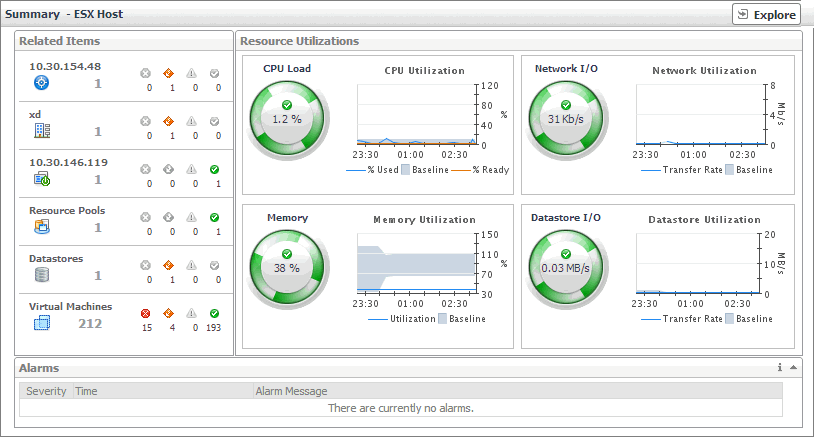
You can review the performance of monitored virtual centers and ESX hosts using the Summary - Virtual Center and Summary - ESX Host views. These views can help you identify and prevent potential bottlenecks by reallocating resources where they are most needed. They appear on the right in the Quick View when you select a virtual center or an ESX host in the left pane.
|
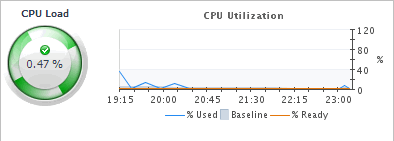
The CPU Load spinner indicates the current percentage of the CPU resources the selected virtual center or ESX host uses to execute system code and user programs, based on the total CPU capacity. The % Used line in the CPU Utilization chart shows the percentage of the CPU resources the selected virtual center or ESX host uses to execute system code and user programs, during the selected time period. % Ready displays the percentage of the CPU resources that are ready for the virtual center or ESX host to execute system code and user programs during the selected time period. The Baseline area in the chart (ESX hosts only) indicates the expected CPU utilization range based on historical data. | ||
|
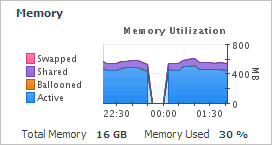
The Swapped line in the Memory Utilization chart shows the amount of memory that is stored in disk swap space, during the selected time period. Shared displays the amount of the virtual machine memory that is freed up due to transparent page sharing. Ballooned represents he amount of physical memory that is actively being used by the VMware Memory Control Driver to allow the guest OS to selectively swap memory. Active shows the amount of the available memory that the virtual center uses during the selected time period. The Total Memory value below the chart is the total amount of memory available to the selected virtual center. Memory Used shows the percentage of the memory resources the selected virtual center currently uses | ||
|
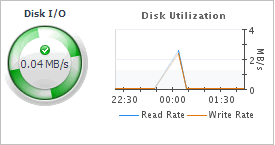
The Disk I/O spinner indicates the rate at which the selected virtual center currently reads data from and writes to disk. The Read Rate line in the Disk Utilization chart represents the rate at which the selected virtual center reads data from the disk during the selected time period. Write Rate displays the rate at which the selected virtual center writes data to disk. | ||
|
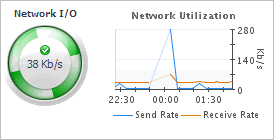
The Network I/O spinner indicates the rate at which the selected virtual center currently reads data from and writes to the network. The Receive Rate line in the Network Utilization chart represents the rate at which the selected virtual center reads data from the network during the selected time period. Send Rate displays the rate at which the selected virtual center sends data to the network. | ||
|
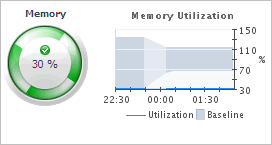
The Memory Load spinner indicates the percentage of the memory resources the selected ESX host currently uses. The Utilization line in the Memory Utilization chart shows the percentage of the memory resources the selected ESX host uses during the selected time period. The Baseline area in the chart indicates the expected memory utilization range based on historical data. | ||
|
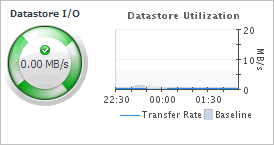
The Datastore I/O spinner indicates the rate at which the selected ESX host currently reads data from and writes to the associated datastore. The Transfer Rate line in the Datastore Utilization chart represents the rate at which the selected virtual center reads data from and writes data to the datastore during the selected time period. The Baseline area in the chart indicates the expected datastore utilization range based on historical data. | ||
|
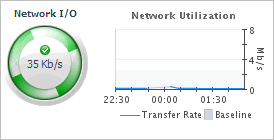
The Network I/O spinner indicates the rate at which the selected ESX host currently reads data from and writes to the network. The Transfer Rate line in the Network Utilization chart represents the rate at which the selected virtual center transfers data from and to the network during the selected time period. The Baseline area in the chart indicates the expected network utilization range based on historical data. | ||
Investigating the use of Datastore resources
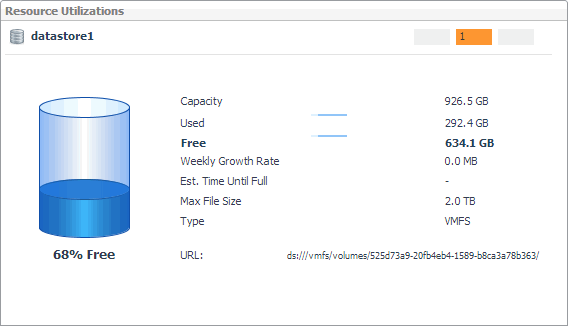
A datastore represents a storage location for virtual machine files. You can review the performance of monitored datastores using the Summary - Datastore view, appearing on the right in the vSphere Infrastructure Quick View, when you select a datastore in the vSphere Infrastructure view on the left. This view displays the overall resource utilization statistics and the amounts of system resource consumption for a physical datastore. This information can help you identify prevent potential bottlenecks. For example, a high amount of used space typically calls for reallocation of storage resources, as required.
Exploring individual Datastores
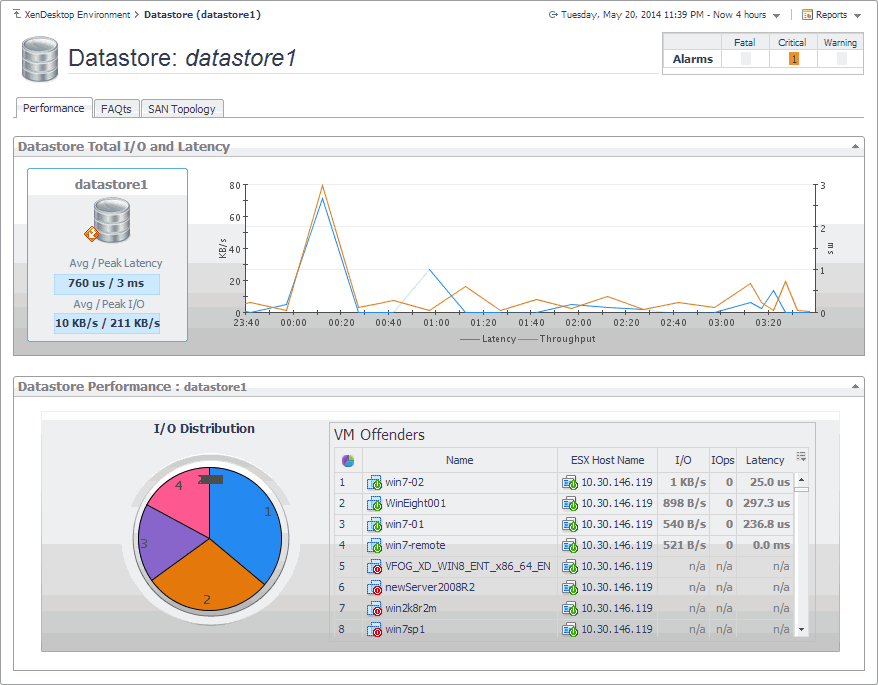
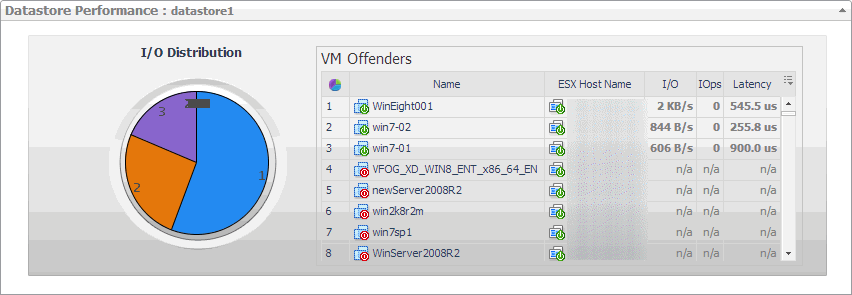
If you see any indicators that could lead to datastore performance degradation, you can explore it in more detail. The Performance tab on the Datastore Explorer view identifies the virtual machines that consume the highest amounts od the datastore resources. Use it to prevent potential performance bottlenecks by reallocating datastore resources where they are most needed.
The FAQTs tab on this view allows you to review common questions and answers about the selected datastore. For more information, see Reviewing Frequently Asked Questions. The SAN Topology tab is provided with Foglight™ for Storage Management. For more information about this tab, see the Foglight for Storage Management User and Reference Guide.
|
The average disk latency and data transfer rates for the selected datastore. | |
|
Identifies potential virtual machine offenders that consume the highest amounts of the selected datastore resources. It also displays a pie chart indicating how much the virtual machines associated with the selected datastore contribute to the overall I/O. For each identified virtual machine, it shows its name, the ESX® host on which it is running, the disk transfer rate, the rate of I/O operations per second, and the average time that passes between the time the virtual machine issues and executes disk read or write operations. |

