Working with Data Analysis Results
From data analysis results you can perform any of the operations described in the following table.
|
If you want to ... |
Then ... |
|---|---|
|
print analysis results |
from the results toolbar: a)Click the print preview icon ( b) Click the print icon (
(Printed results will contain only the data that is currently expanded.) |
|
export analysis results |
choose an Export to the selected format option from the drop-down, then click the Export link. NOTE: If you export to Excel, all data will be exported, regardless of whether it is expanded. If you export to an Acrobat (PDF) file, only data that is currently expanded will be exported. |
|
download raw analysis result data to a CSV file that can be imported into another program for further examination |
click the Download as CSV hyperlink in the results toolbar. This option differs from the csv option in the Export... drop-down in that it provides all of the raw data (including object GUIDs and internal field names, for example) used to create the report. This may be useful for troubleshooting or for more in-depth analysis. |
|
perform a ControlPoint action or analysis within the current workspace |
use the procedure for Acting on Search or Data Analysis Results. |
|
return to the results of an analysis from which you drilled-down |
click the Back button in the results toolbar. |
Linking to SharePoint Pages and Other ControlPoint Analyses from Analysis Results
When run interactively*, from the results of most ControlPoint analyses, you can:
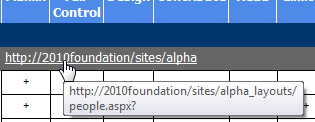
·open relevant SharePoint pages
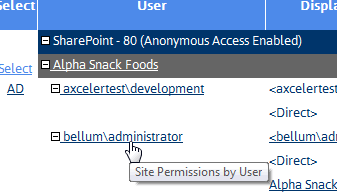
·generate applicable ControlPoint analyses for the same scope and parameters.
Links to SharePoint pages always open in a separate browser window or tab.
Links to ControlPoint analyses may either open in a separate browser window/tab or in the current workspace, depending on the value of the Open drill-downs in new window .
* Generally, these links are not functional in analysis results that have been exported, although in some cases they may be.
Acting on Search or Data Analysis Results
From ControlPoint search or data analysis results, you can open a SharePoint page or initiate a ControlPoint action or another analysis for selected objects.
This feature can facilitate the performance of a variety of administrative tasks. For example, you can generate a Site Permissions analysis to identify the users who have been granted permissions directly, then initiate the appropriate action (such as Add User to SharePoint Group).
To select objects on which to perform a ControlPoint action or analysis:
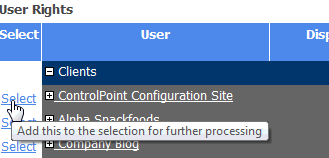
1Click the Select link for the object on which you want to act.
NOTE: To select all objects in the results list, click the Select All link in the Results header.
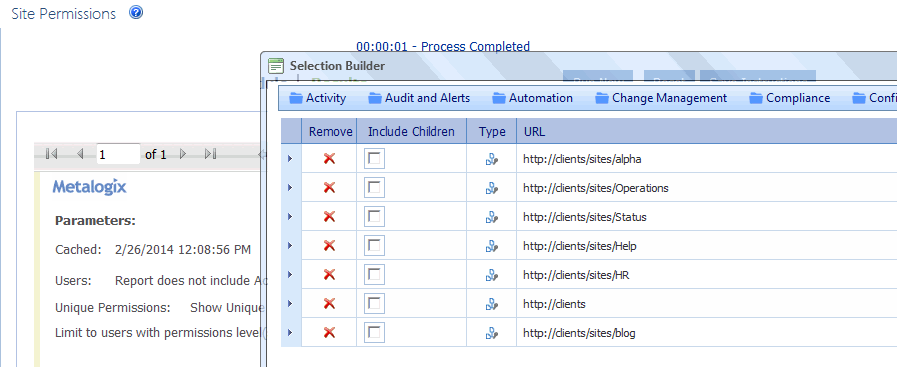
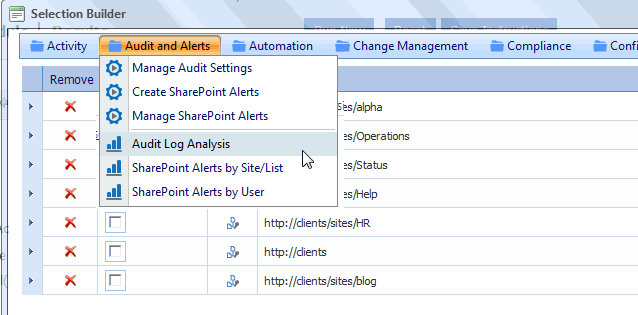
The Selection Builder opens in a separate window.
NOTE: If you want the Selection Builder to remain open in a static location in the browser window, click the Pin On icon (

2If you want to select additional objects, either:
§click the Select All link in the analysis results Select column for each additional item you want to add to the Selection Builder.
OR
§from within the Selection Builder, use the procedure for Changing Your Selection.
3Choose the applicable SharePoint page or ControlPoint operation from the Selection Builder menu.
§Note that the rules for selecting objects from the left navigation pane apply here as well. For example, only options that are appropriate for the selected object(s) are available.
NOTE: The Selection Builder will appear minimized until you click Restore (
Working With Analysis Results Interactively
The ControlPoint Interactive Analysis functionality lets you work with raw data underlying a ControlPoint analyses in an interactive, tabular format. You can:
·create customized interactive analysis configurations
·create charts using selected data points
·print/export results
·initiate a ControlPoint operation on selected rows of data.
NOTE: This option is not available for farms running SharePoint 2013 or later.
Prerequisite
To use ControlPoint Interactive Analysis functionality, the appropriate version of Microsoft Silverlight must be installed locally. If it is not, you will be prompted to download it from the Microsoft Silverlight website. Once it has been installed, you will have to restart your browser.
NOTE: If you are prohibited by company policy from installing Silverlight on your machine, you will be unable to use Interactive Analysis functionality. ControlPoint Application Administrators can also configure the application so that the Interactive Analysis link is hidden.
To access the Interactive Analysis functionality:
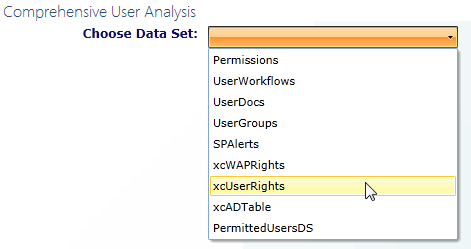
From the analysis results toolbar, click the Interactive Analysis link.
A drop-down from which to choose a data set displays. The number of data sets available depends on the complexity of the analysis. For example:
The Comprehensive User Report is a complex analysis with multiple sections and therefore, multiple datasets.
The Scheduled Jobs Report is a more simplified, "flat" analysis with a single data set.
Analyzing Data Sets in Tabular Format
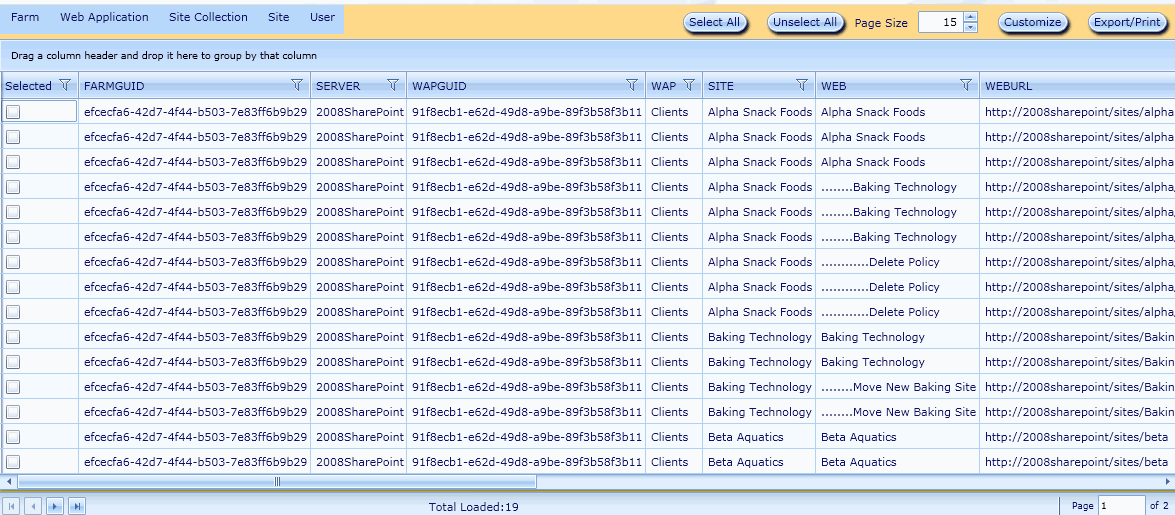
By default, all of the data in the selected data set displays in the interactive analysis table.
You can
·sort by any column (by clicking the column header)
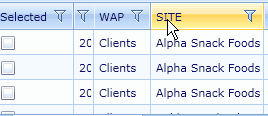
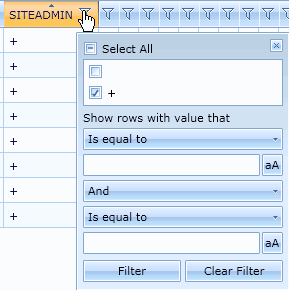
·filter by values within a column (by clicking the 
·change the order of columns (by dragging/dropping a column header).
Customizing the Configuration of the Dataset
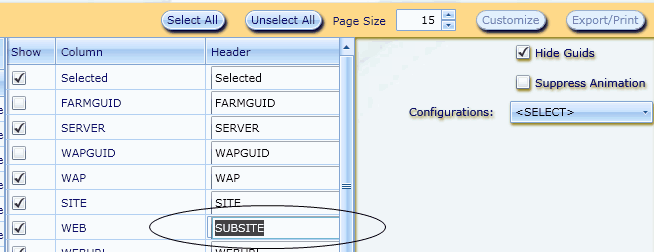
If you want to customize the configuration of the current dataset, click the [Customize] button. You can then:
·select/deselect columns that you want to show/hide (including all Guids)
·change the names of column headers
To apply configuration changes (and close the customization panel), click [OK].
NOTE: Changes to the data set display are analysis- and user-specific and are "sticky." That is, the next time you launch an interactive analysis for an analysis of the same type, any customizations you made will be retained for your login. You can also save a custom configuration to share with other ControlPoint users.
To save a customized configuration for sharing with other ControlPoint users:
1From the Configurations: drop-down, select <Save as new configuration>.
2In the Save configuration as: field, enter the name you want to give to the configuration.
3Click [OK].
4The new configuration is added to the Configurations: drop-down for the selected analysis type and is available for selection by all ControlPoint users.
Printing or Exporting the Current Dataset Configuration
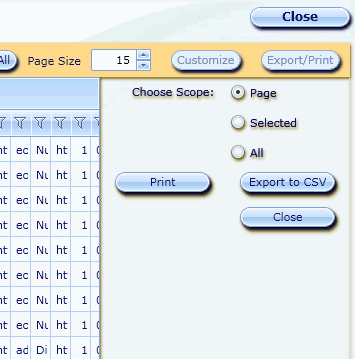
Click [Export/Print], then Select the appropriate option(s).
NOTE: The dataset will print to a single page, but it cannot be automatically scaled or resized to fit within a specific print area. You can adjust the configuration and column widths of the dataset, and you may be able to adjust your printer settings (paper size, orientation, and so on) to compensate.
Creating a Chart from the Current Dataset Configuration
You can create an ad-hoc pie, bar, or line charts to graphically represent selected data points. The Values (y) column drop-down contains data points with numerical values; the Series (x) column drop-down contains data points with all other data types.
NOTE: Remember that because both drop-downs are populated with raw data, not every dataset or combination of data points will produce a meaningful chart.
After selecting data pointsand after making any changes to a chartclick [Show Chart] button to refresh the display.
The examples below compare the size of each content database in a SharePoint farm using a bar chart and a pie chart.
To print a chart, click [Print Chart (WYSIWYG)].
NOTE: In this context, "WYSIWYG" means that the chart will not be automatically scaled or resized to fit within a specific print area. You may be able to adjust your printer settings (paper size, orientation, and so on) to compensate.
To initiate a ControlPoint operation from an interactive analysis:
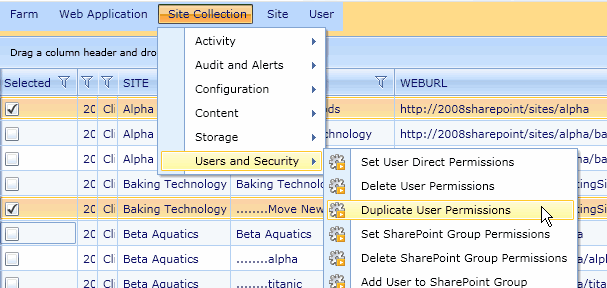
1Select each row of data containing the object that you want to include in the operation (by checking the corresponding Selected box).
2Select an operation from the appropriate menu.


 ).
).


