Automate Excel® Pivot Table Reports
Excel pivot tables are an excellent way to display data to your end users. You can include a pivot table in an Excel report and use Automation to refresh the pivot table’s source data in the report.
In this example, you will export data to an Excel file with a pivot table. The script will export data to a worksheet in the Excel file. The exported data will refresh a pivot table located on another worksheet in the same file.
 Watch a video version of this tutorial: Automate Excel Pivot Table Reports
Create Excel File Template
- To start, create an Excel file.
- In this Excel file, name one worksheet Data. This will be used to store the result set. Name the other worksheet Pivot. This worksheet will contain the pivot table generated from the result set.
- Build the pivot table from the range of data on the Data worksheet. You may want to start with an existing file that contains the data you want to export, or a file with an existing pivot table. Make a note of the address of the first cell in the range of data on the Data worksheet.
-
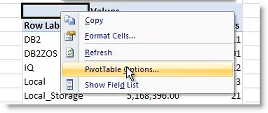
In Excel, after the pivot table is built, right-click on the pivot table and select PivotTable Options.

- In the PivotTable Options dialog, on the Data tab, make sure that the Refresh data when opening file option is selected. This will ensure that Excel refreshes the pivot table each time data is exported.
Create Automation Script
- Open a new Automation window (Tools | Automation).
- Click the Select to File activity to add it to the Automation design window.
- Select a database connection or use the default.
- Then select a SQL file (or enter a SQL statement).
- Click
 in the Name field, and select the Excel file that you created previously.
- Deselect Overwrite and do not add a suffix.
- Click Export options. The Export options dialog opens.
- In the Worksheet name field, enter Data or select it from the list.
- Do not select to clear the worksheet.
- In the Start export at field, enter the column and row of the first cell in the range of data on the Data worksheet. Click OK to close the dialog.
-
Click Run to save and run your script.
- View the Excel file by clicking the hyperlink in the Log tab. The Data worksheet contains the exported data. The Pivot worksheet contains a pivot table built on the exported data.
- You can test the refresh behavior of the pivot table by modifying your SQL statement slightly and then re-executing the script. After the script re-executes, open the Excel file. The pivot table should reflect the new result set.
The output of this script is an Excel file containing a pivot table of a result set. Each time the script executes, the pivot table is refreshed from the new data.
Schedule A Script
See Schedule Your Script to learn how to schedule the Automation script.
Related Topics
Getting Started with Automation


 in the Name field, and select the Excel file that you created previously.