Release Notes
Wednesday, August 15, 2018
SQL Optimizer for SQL Server® is the most comprehensive optimization solution available for SQL Server environments. SQL Optimizer helps you shorten tuning time and optimizes database performance. You can:
This release of SQL Optimizer for SQL Server includes the following new features and enhancements.
This release of SQL Optimizer for SQL Server is a minor release and includes resolved issues and minor enhancements.
See Resolved Issues and Enhancements for a complete list.
SQL Optimizer 10.0.3 is a minor release and includes the following enhancements. See also Resolved Issues and Enhancements.
This release includes support for Microsoft SQL Server 2016.
SQL Optimizer for SQL Server 10.0.1 is a maintenance release and includes primarily resolved issues. See Resolved Issues and Enhancements for more information.
The Find SQL module now includes a new dashboard-style summary page for search results.
Click a pie chart to open Top SQL, Top Batches, or Top Database Objects and quickly drill down to result details.

The number of SQL used in each pie chart is the Top n SQL suggested by SQL Optimizer. Click a pie chart to open the Summary Chart where you can adjust this number to fine-tune your view.

Use the dashboard page to easily navigate between results views. This page also remembers your last view.

Find SQL also conveniently groups the collected SQL statements into SQL Classification categories (problematic, complex, simple, and invalid).
The dashboard displays a color-coded pie chart that helps you visualize the percentage of SQL statements in each classification category. The legend lists the number of SQL in each category.

You now click View Details to see the SQL details for Top SQL, Top Batches, or Top Database Objects.

Each Summary Chart view now includes a Classification Type column in the SQL grid.

The Details page has been redesigned to make it easier to view and compare SQL details.
When viewing details, you can now display the SQL text highlighted within the context of the batch or object.

When viewing results by batch/object, expand the batch/object node to see the list of SQL in that batch/object. Select a SQL statement to see its details.

In the Details view for Top SQL, select a SQL statement and drill down to see batch or object details.

New Test Run buttons replace the Execute and Batch Run buttons. Each button includes new sub-commands with slightly different functionality. These buttons have been redesigned to streamline the test run process. (To specify the number of records to retrieve and the number of times to test run alternatives, use the Test Run Settings dialog or the Test Run Special Settings dialog.)
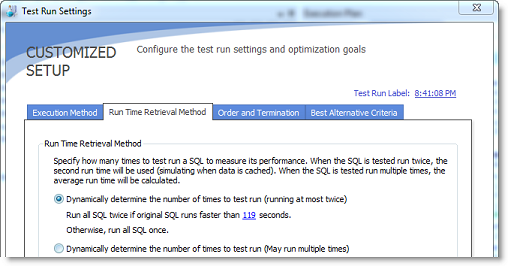
The Test Run All group button replaces the Batch Run button. This new button includes the Test Run - All and Test Run - Selected commands to test run all alternative or a selected group of alternatives simultaneously. Use the Test Run Settings dialog to specify other options.

A new Test Run Settings dialog replaces the Session Batch Run Criteria dialog. This dialog opens when you select Test Run - All or Test Run - Selected.
This new dialog streamlines the process of selecting test run options.
Simplify the process of selecting test run settings by answering three questions about your original SQL. SQL Optimizer automatically determines the best test run settings based on your answers.

If you prefer, you can specify test run settings manually by selecting the Customize Test Run Settings link at the bottom of the page. The Custom Setup page opens where you can specify detailed options for your test run.


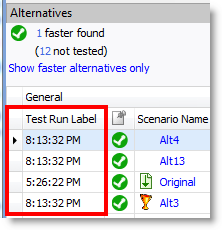
You can now apply a label to a test run to identify all alternatives that were executed in that test run. The label is displayed in the Test Run Label column in the Alternatives or Plans grid. Use the default timestamp or create a custom label.

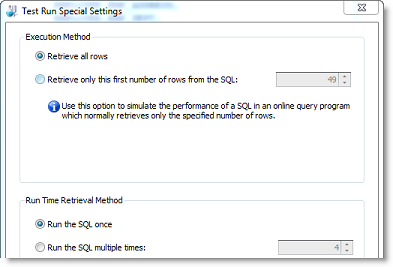
You can now specify test run options when you test run a single SQL or plan alternative.
Select the Test Run Special - Current option to test run the alternative. The Test Run Special Settings dialog opens where you can specify the number of records to retrieve and the number of times to test run the alternative.


Find blogs, forums, and other product resources on Toad World.
The following feature/features are no longer included in SQL Optimizer for SQL Server.
Integration with Foglight Performance Analysis. Beginning with SQL Optimizer for SQL Server 10.1, you can no longer gather SQL from a Foglight Performance Analysis Repository.
The following is a list of issues addressed and enhancements implemented in this release.
| Feature | Resolved Issue | Defect ID |
|---|---|---|
| Optimize Indexes | When gathering a SQL workload from a Spotlight Statistics Repository, after switching from one Monitored Instance to another, the "Date Collected" drop-down list is enabled as expected. | SOFSS-1327 |
| Syntax | Corrected an issue which caused an "Incorrect syntax" error when attempting to retrieve the execution plan for SQL containing a CASE statement inside a PARTION BY clause. | SOFSS-1320, SOEP-2248, ST115572 |
| Feature | Resolved Issue | Defect ID |
|---|---|---|
| Integration with other Quest products | Corrected an issue which prevented integration with Foglight. | ST118843, QSOSS-517 |
| Integration with other Quest products | Corrected an issue that caused an error when sending SQL to the Optimize SQL module in SQL Optimizer for SQL Server from Foglight. | ST118832, QSOSS-1198 |
| Optimize Indexes | Corrected an issue that caused an error when attempting to connect to a Spotlight Statistics Repository in a SQL Server 2016 database to collect SQL. The error text included the following: "Procedure or function spotlight_get_monitored_objects has too many arguments specified." | QSOSS-1245 |
| Optimize SQL (SQL Rewrite) | Corrected an issue that caused an "Objects of this type have no space allocated" error when attempting to generated Index alternatives. | ST118919, QSOSS-1199 |
| SQL Server 2016 | Added support for the new query hint argument, USE HINT, in SQL Server 2016 SP1. | QSOSS-946 |
| SQL Server 2016 | Added support for new DATEDIFF_BIG function in SQL Server 2016. | QSOSS-953 |
| Syntax | Corrected a syntax issue in which a column was incorrectly treated as a bind variable. This issue was encountered when the SQL contained either a "left join" or "right join," the first table had no alias, and columns in the first table were qualified with the table name. | ST118920, QSOSS-568, QSOSS-1200 |
| Syntax | Added support for $IDENTITY and $ROWGUID. | QSOSS-959 |
| Feature | Resolved Issue | Defect ID |
|---|---|---|
| Integration with Toad for SQL Server | When sending SQL from Toad for SQL Server to SQL Optimizer to Auto Optimize, the Test Run Settings dialog opens as expected. | ST115905, ST115914, QSOSS-449 |
| Optimize SQL | An issue that resulted in incorrect values for "Time Saved (%)" and "Times of Improvement" in the Report page for an Optimize SQL session is resolved. | ST116812 |
| Optimize SQL | After selecting Clear Optimization Results | Clear Original Scenario in the Alternative Details pane and then entering SQL again, the Get Estimated Plan button works as expected. | QSOSS-401 |
| Optimize SQL | If you attempt to generate indexes when optimizing a SELECT INTO statement, you will no longer encounter "An object or column name is missing or empty" error message. | ST116701 |
| Feature | Resolved Issue | Defect ID |
|---|---|---|
| Find SQL | When creating a new Plan Cache search, the user was unable to start the Plan Cache search process after closing the Top SQL selection text box by clicking the close [x] button. | ST113068 |
| Find SQL | When collecting SQL, the number of SQL now updates dynamically on the Show All Searches page. | ST114802 |
| Find SQL | An issue that caused an empty XML file to be generated when saving an execution plan in Find SQL is resolved. | ST114881 |
| Find SQL | In the Summary Chart, the Primary Statistics (y-axis label) correctly updates after selecting to view a different primary statistic (resource type). | ST114937 |
| Optimize SQL | Old execution statistics are now cleared after original SQL is rewriten and execution plan is retrieved. | ST109320 |
| Optimize SQL | Improved performance of SQL Rewrite process. | ST113052 |
| Optimize SQL | Added support for synonyms. | ST74220 |
| Optimize SQL | An issue that caused an "Out of Memory" error when using Batch Run to run SQL that returns a large number of rows is resolved. | ST112494 |
| Optimize SQL |
An issue that caused the "SQL Extraction" to display when inputting a single invalid SQL statement is resolved. |
ST113628 |
| Optimize SQL | Revised termination criteria in Batch Run. | ST113710 |
| Optimize SQL | Optimize SQL now points out the best value for each statistic. The value is displayed using bold text to highlight it. | ST114018 |
| Optimize SQL | An issue that caused duplicate columns to display for remote objects in the Schema Information tab is resolved. | ST114083 |
| Optimize SQL | Optimize SQL failed to generate alternatives for some SQL containing linked server objects. This issue is resolved. | ST114279 |
| Optimize SQL | Support for SQL Server 2014 cardinality estimator. You can enable/disable in Options. | ST114816 |
| Optimize SQL | Importing a session from STS files is no longer supported. | ST114826 |
| Optimize SQL | When sending multiple SQL alternative containing the same bind variable to Benchmark Factory, the scalability job failed because only the first SQL received the bind variable. This issue is resolved. | ST114842 |
| Optimize SQL | After opening a saved session, the user-defined alternative would contain duplicate indexes. This issue is resolved. | ST114845 |
| Optimize SQL | An issue that caused the application to unexpectedly close when selecting the Virtual Indexes tab in a saved session shortly after creating a new session is resolved. | ST114939 |
| Optimize SQL | SQL Rewrite: When auto-optimizing SQL containing a temp table and a bind variable, the original SQL test runs successfully and no longer displays an error icon in the status column. | ST114979 |
| SQL Scanner | The SQL Scanner now supports the following syntax: [server].[database].[schema].[object] | ST41156 |
| System Requirements | Include support for Windows 8.1 and Windows Server 2012 R2. | ST113995 |
| System Requirements | Include support for Windows 8.1 (with Update) and Windows Server 2012 R2 (with Update). | ST114511, ST114878, ST114879 |
| User Interface | If you input your original SQL from a file, when saving the SQL as a SQL text file again, for convenience the default file name in the Save As dialog is now set to the original file name. | ST113215 |