Spotlight on Unix Home Page
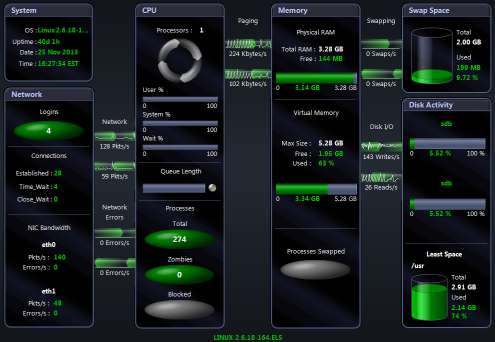
The Spotlight home page shows the flow of information and commands between various sub-components and the size and status of internal resources such as processes, disk files and memory structures.
Related operating system statistics are grouped together on panels that are connected by a series of graphical flows and icons. Spotlight updates these flows in real time so you can see how quickly data is moving through the system. The icons change color as Spotlight alarms are raised, upgraded, downgraded and canceled.
Tip: Hover the mouse pointer over a panel component for more information.
To see the Spotlight on Unix Home Page
- Select the Spotlight on Unix connection from the Spotlight browser.
- Click
 .
.
Related Topics
Spotlight Home Pages
Spotlight Home Page Components
Spotlight on Unix Alarms
Spotlight alerts you to problems with your system by issuing an alarm.
|
Blocked Process Alarm |
Blocked processes are processes that are waiting on information to become available in memory, or that are waiting for a shared resource, or for the completion of disk I/O or network I/O. A high level of blocked processes may indicate an under-configured machine. |
|
Input Error Packets Flow Alarm |
The Input Error flow represents the number of erroneous network packets coming into the machine per second. The Input Error Packets Flow alarm may warrant investigation as even a low error rate can indicate network problems. |
|
Output Error Packets Flow Alarm |
The Output Error flow represents the number of erroneous network packets sent by the machine per second. The Output Error Packets Flow alarm may warrant investigation as even a low error rate can indicate network problems. |
|
Page In Alarm |
A large number of page-ins may be a symptom of a large number of recent page-outs (see Page Out alarm below). To find out what process is reading these pages in, check the resident size of the processes you are running, and see which ones are increasing in size. Alternatively, a large number of page-ins may occur when a large process has just stopped, and the kernel decides to fill that space with memory pages owned by other processes. Check if an important process has ended unexpectedly. |
|
Page Out Alarm |
If an active process asks the kernel for more memory than there is immediately available, the kernel will write old memory pages out to swap space. This is known as paging. To stop paging, make sure that there is enough RAM available to support the size of the processes you want to run. |
|
Percentage Busy Alarm (Most Active Disk) |
The Most Active Disk gauge shows the disk with the highest read/write rates. The Percentage Busy alarm is triggered when the read/write rate of the most active disk exceeds a specified threshold. The type of alarm that is activated is determined by the percentage of read/write activity experienced by the disk. |
|
Disk I/O wait time |
The Disk I/O wait time alarm is triggered when one of the disks' I/O wait time exceeds a specified threshold. |
|
Disk I/O service time |
The Disk I/O Service Time alarm is triggered when one of the disks' I/O service time exceeds a specified threshold. |
|
Swap Space Alarm |
If the total amount of swap space allocated to a Unix host becomes full, the machine may halt all processes, or critical actions may be prevented from occurring. The Swap Space alarm may indicate a runaway process or an under-configured machine. |
|
Swap In Flow Alarm |
The Swap In flow represents the number of processes swapped from disk per second. The Swap In Flow alarm may indicate a machine that is under-configured for its workload. |
|
Swap Out Flow Alarm |
The Swap Out flow represents the number of processes swapped to disk per second. The Swap Out Flow alarm may indicate a machine that is under-configured for its workload. |
|
Unix Status Alarm |
Spotlight is re-establishing its connection to the Unix system. |
|
Used Percentage Alarm |
The Least Space / Disk Space container displays the percentage of used disk space for a specified filesystem. The Used Percentage alarm indicates that the specified filesystem is full or filling up. If the filesystem fills up completely, no more data can be written to it. |
|
Zombie Processes Alarm |
The Zombie button in the CPU panel shows the number of terminated child processes that have not been acknowledged by their parent process. The Zombie Processes alarm may indicate the presence of an inferior program, or an entry in /etc/inittab (or equivalent) that prevents init from completing its startup sequence. |
Related Topics
Spotlight Alarms
Spotlight Today
Alarms by Time
Alarm log
Spotlight on Unix Drilldowns
Once a problem is isolated you can display a drilldown page with charts and tables that provide a detailed breakdown of the underlying statistics.
| Processes and Services |
 |
CTRL+P |
Processes Page | Zombies Page | Services Page |
The Processes and Services drilldown lists all the processes running on the Unix machine (including "zombie" processes), and all the services found in the /etc/services file (running or not). |
| Activity Summary |
 |
CTRL+A |
Activity Page | Disk Page | Memory Page | CPU Page | Network Page | Logins Page |
Use the Activity Summary drilldown to show details of the activity on the Unix system. |
| Filesystems |
 |
CTRL+S |
Filesystems And Disk Information |
Use the Filesystems drilldown to show disk usage for each filesystem on the Unix system, and the proportion of disk space used by each filesystem. |
| Alarm Log |
 |
CTRL+L |
Alarm log | Alarms by Time | Spotlight Today |
The Alarm Log drilldown displays information on the alarms associated with the Windows system, including the name of the component that issued the alarm, the date and time the alarm was logged, and the severity of the alarm.
Note: The Alarm Log drilldown is common to all Spotlight applications. The alarms are specific to the current Spotlight connection. Spotlight on Unix Alarms |
Related Topics
Spotlight Drilldown Pages
Spotlight on Windows
Use Spotlight on Windows to monitor Windows operating systems, detect and resolve problems.
| Connect to Windows Systems |
Create / Modify / Delete connections to Windows systems. |
| Spotlight on Windows Home Page |
The Spotlight home page shows the flow of information and commands between various sub-components and the size and status of internal resources such as processes, disk files and memory structures. |
| Spotlight on Windows Alarms |
Spotlight alerts you to problems with your system by issuing an alarm. You can configure Spotlight in the level of severity that constitutes an alarm, to disable an alarm, and the actions Spotlight takes on raising the alarm. |
| Spotlight on Windows Drilldowns |
When you have isolated a problem, you can display a drilldown page, whose charts and tables provide a detailed breakdown of the underlying statistics. |
| Troubleshooting Spotlight on Windows |
This section identifies general problems that you may encounter when using Spotlight on Windows, and details how to address those problems. |
