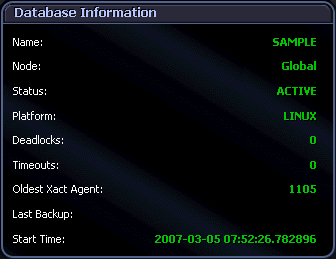
The Database Information panel provides current high-level status information about performance of the DB2 database or partition that you are monitoring.
At each refresh, Spotlight captures the following statistics and displays them for the Database Information panel. You can use the Metric Editor to customize thresholds for the metric behind each statistic to generate appropriate alarms.
The illustration below provides an example of the information shown in the HADR panel.

Review the following for additional information:
| Name | The name of the database you are monitoring. |
| Node | The partition number of the database partition you are monitoring. If a database is being monitored, Global is shown. |
| Status | The current status of the database you are monitoring. This can be Active, Quiesce Pending, Quiesced, or Roll Forward. |
| Platform | The type of operating system on which the database server runs. |
| Deadlocks |
The number of deadlocks that have occurred in the database or partition. If this number is high, applications can experience contention problems caused by any of these conditions:
Access the Client Application Analysis drilldown to determine in which applications the deadlocks are occurring. Perhaps tweaking these applications will enable them to execute with a higher degree of concurrency. |
| Timeouts |
The number of times that a request to lock an object timed out instead of being granted. Use this information to adjust the setting of the LOCKTIMEOUT database configuration parameter. When the number of lock timeouts becomes excessive compared to normal operating levels, the following conditions might exist:
On the other hand, if you have very few lock timeouts, the LOCKTIMEOUT parameter might be set too high. If the LOCKTIMEOUT value is too low, applications can experience high lock wait times. |
| Oldest Xact Agent | The ID of the application with the oldest active transaction. Check the Client Application Analysis drilldown to see the name of the application. This statistic can help you determine whether the application should commit more frequently in order to free up log space. |
| Last Backup | The date and time that the latest database backup was completed. Use this information to identify a database that has not been backed up recently or to identify which database back-up file is the most recent. If the database has never been backed up, no value appears for this statistic. |
| Start Time |
The timestamp showing when the first connection to the database occurred or when the ACTIVATE DATABASE command was issued. This timestamp uses the following format: year-month-day hour:minutes:seconds.mircoseconds |
Some of the displayed statistics are associated with DB2 database configuration parameters, as mentioned in the description for each statistic. If any of these statistics raises concerns about performance, you might consider modifying the configuration parameter with which the statistic is associated.
Click individual statistics in the Database Information panel to open the Databases drilldown. This drilldown provides detailed information on the database or partition that you are monitoring. The Details tab on the drilldown is in immediate focus so you can examine these and other performance-related statistics.