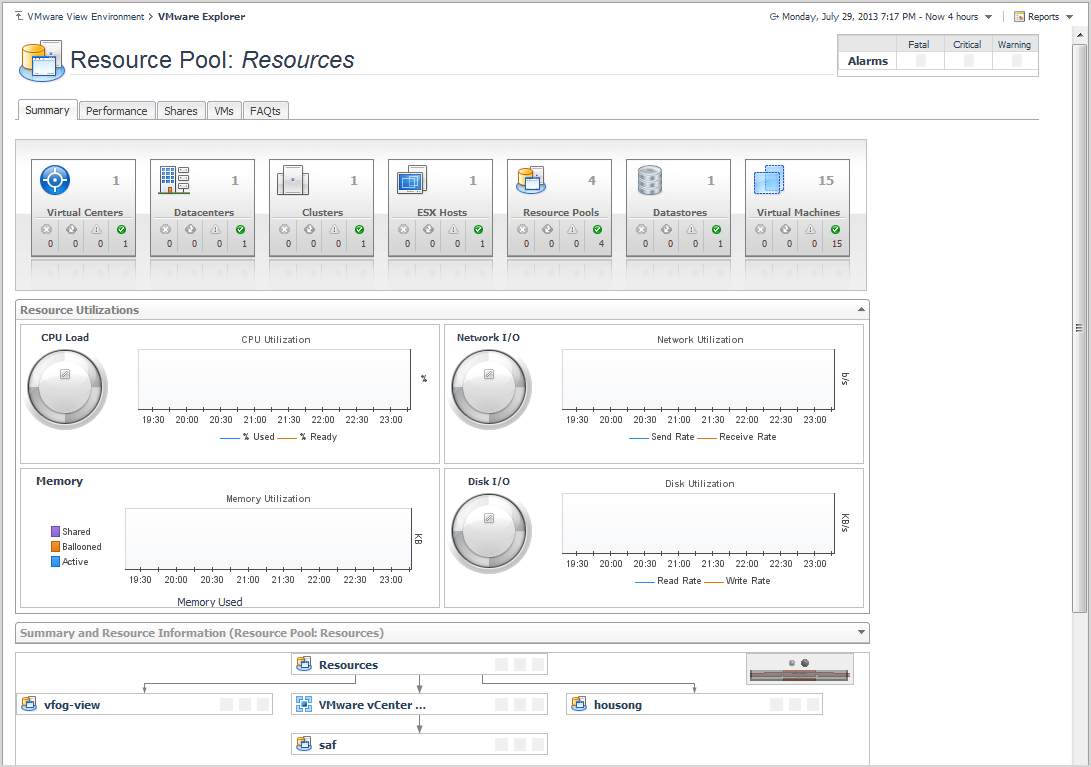
For more information about the VMware Explorer dashboard, see VMware Explorer View .
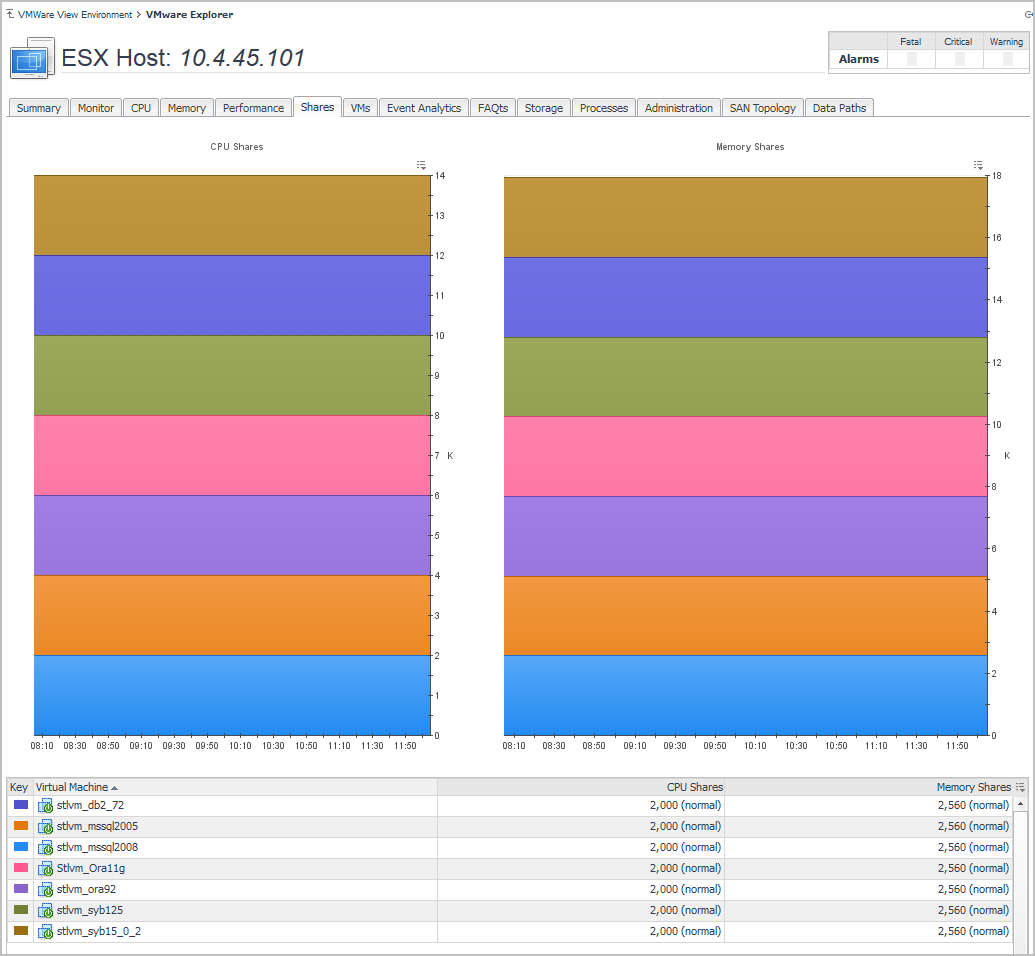
This tab is available in the VMware Explorer. To find it, open the VMware Explorer and on the Virtual Infrastructure view, that appears on the navigation panel, select a cluster, ESX® host, or resource pool instance. In the VMware Explorer, open the Shares tab.
The VMware Explorer’s Shares tab displays the CPU and memory shares that are in use by the virtual machines associated with the selected component.
This view is made up of the following embedded views:
This view shows a list of all virtual machines that are associated with the selected cluster, ESX host, or resource pool instance. For each virtual machine, it displays its name along with a color indicator for displaying this information in the Active Memory and Shared Memory views. The list also shows the numbers of CPU and memory shares used by each virtual machine.
This tab is available in the VMware Explorer. To find it, open the VMware Explorer and on the Virtual Infrastructure view, that appears on the navigation panel, select a Virtual Center, Datacenter, Cluster, ESX® host, or virtual machine instance. In the VMware Explorer, open the Storage tab.
The VMware Explorer Storage tab displays combination of embedded views organized into physical drive and logical disk sections. It identifies the physical drives with the highest disk activity, and the logical drives with the lowest capacity. It also lists all physical drives for the selected server, their read and write rates, along with the logical drives, the space used on each and shows data growth patterns and the related estimates.
This view is made up of the following embedded views:
The Summary tab is provided as part of the VMware Explorer dashboard Primary view. You can open this tab from the top of the VMware Explorer Primary view. For more information about the VMware Explorer dashboard, see Use the VMware Explorer .