The Agents view appears on the VMware View Environment dashboard. For more information about this dashboard, see Use the VMware View Environment dashboard.
This view is available from the action panel when you click View Virtual Infrastructure Alarms. The VMware Alarms dashboard provides an Alarms List view, which takes up the majority of the dashboard.
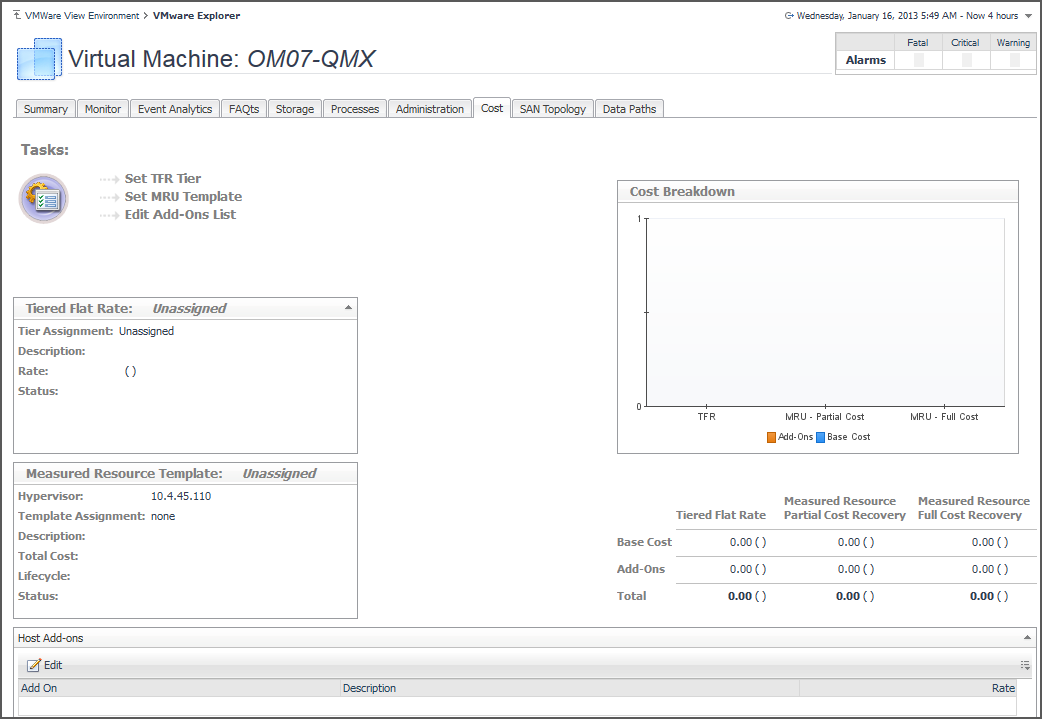
This tab is available in the VMware Explorer. To find it, open the VMware Explorer and on the Virtual Infrastructure view, that appears on the navigation panel, select a virtual machine instance. In the VMware Explorer, open the Cost tab.
The VMware Explorer’s Cost tab contains information about the costs associated with the selected host’s usage. The information about these costs is provided by the cost models and host assignments that are configured in Foglight Chargeback. For more information about Foglight Chargeback, see the Foglight Chargeback User and Reference Guide.
This view is made up of the following embedded views:
|
• |
This tab is available in the VMware Explorer. To find it, open the VMware Explorer and on the Virtual Infrastructure view, that appears on the navigation panel, select an ESX® host instance. In the VMware Explorer, open the CPU tab.
The VMware Explorer’s CPU tab displays the combined CPU utilization for an ESX host, showing the amount of processing speeds that are used by each virtual machine that is running on that host. This includes the amount of used processing speed, and the percentage of time the CPU resources are ready for use, all during a selected time period.
This view is made up of the following embedded views:
This view shows a list of all virtual machines that are running on the selected ESX host. For each virtual machine, it shows its name, the percentages of CPU resources that are used and ready for use, along with a color indicator for displaying this information in the CPU Utilization (Used) and CPU Utilization (% Ready) views. It also allows you to show or hide the related resource use from these views.