Tchater maintenant avec le support
Tchattez avec un ingénieur du support

Foglight for vCloud Director 5.7.4.1 - User and Reference Guide

Getting Started Setting Up Monitoring Agents Investigating Resource Consumption Levels Investigating Object Dependencies Reference

vApp, Cluster, and Datastore tiles

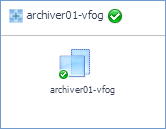
The vApp, cluster, and datastore tiles are somewhat simpler in that they displays just the name of the component and its severity state, and also the name and severity state of the containing objects: virtual machines, resource pools, and datastores.

Figure 45. vApp tile

Setting the Zoom Level

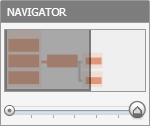
In larger multi-component environments, a typical dependency map is likely complex and cannot fit your screen. The NAVIGATOR in the top-right corner allows you to easily set the zoom level by dragging the slider into the appropriate position. You can also display a desired part of the map by dragging the grey rectangle.

Figure 46. Navigator

Starting your Investigation

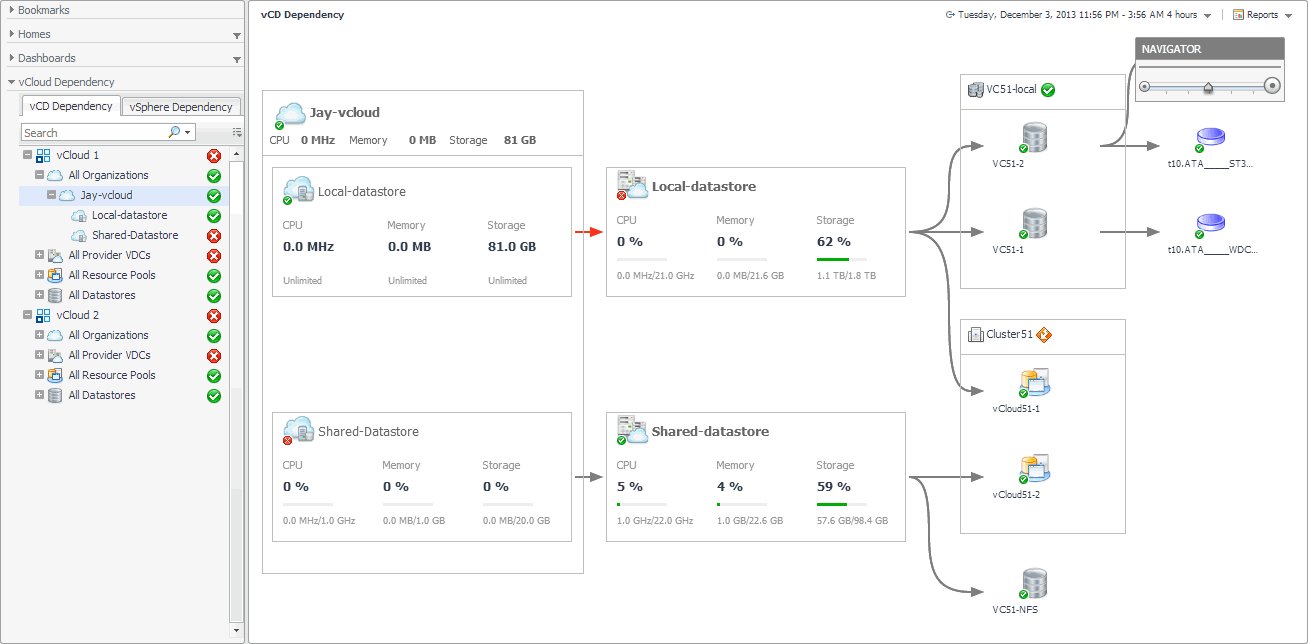
To get started with your investigation, first select a desired object in the navigation tree. The vCD Dependency dashboard refreshes showing your object and any related dependencies. Observe related components and their alarm states. This can give you a good indication of any potential bottlenecks or performance issues.

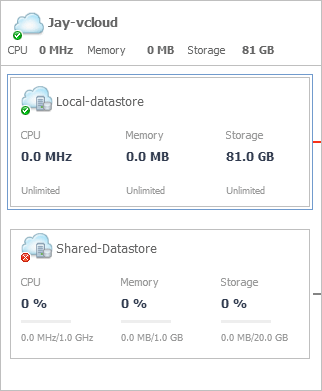
Some objects in the dependency map are displayed in multi- and single component tiles, and object icons. The type and range of the objects appearing on the vCD Dependency dashboard depends on the selected objects and the dependencies that object has within your integrated infrastructure. To better understand the map, every object type is identified with an icon. For more information, see Identifying Dependency Map Elements.

For example, when you select an organization in the navigation tree, the dependency map displays a tile representing the organization object consisting of one or more organization vDCs.

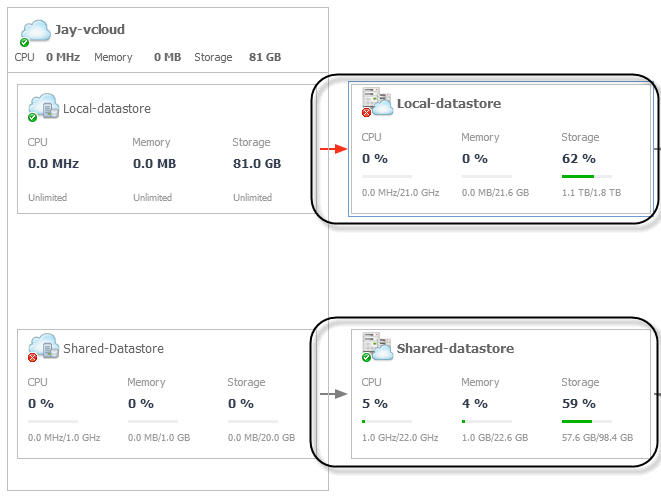
The tile displays the current CPU, memory, and disk usage for the organization object as a whole, and for any organization vDCs that belong to the selected organization. Alarm states are also given for the organization and any comprising organization vDCs. Next, the map shows any provider vDCs on which these organization vDCs depend.

Figure 49. Provider vDCs

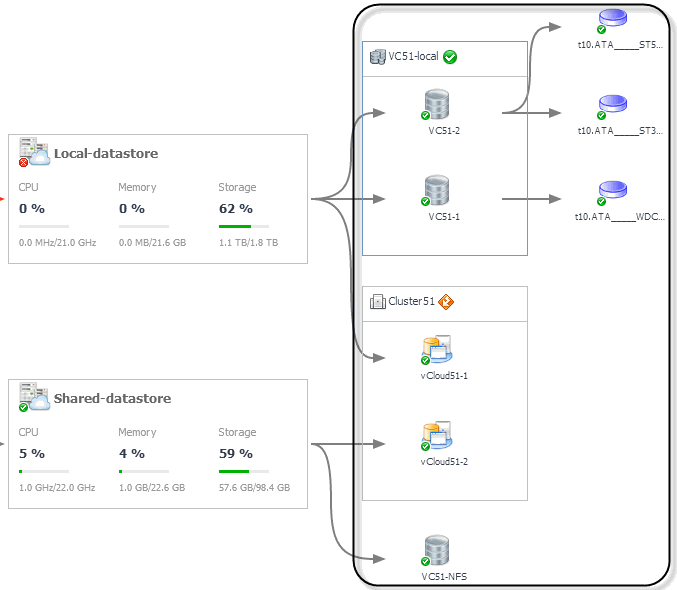
CPU, memory, and disk usage metrics appear for the provider vDCs, along with their alarm states. The map also shows the datastores and resource pools the provider vDCs use, and the elements in and elements associated with these objects, such as datastore and VMware clusters.

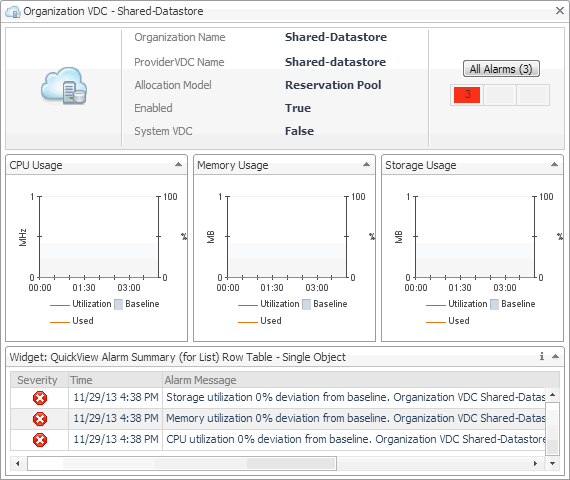
To find out more information about any of the displayed components, click the appropriate tile to display more information. For example, if you see an object that is in Fatal state, you can drill down on it to review the existing alarms and investigate further the root cause of the issue.


Reference

This contains reference information about rules and metrics that are defined in Foglight for vCloud Director. Read this to find out details about these components.

Documents connexes

The document was helpful.

Sélectionner une évaluation

I easily found the information I needed.

Sélectionner une évaluation