|
NOTE: When a component is selected, its detail views display the component’s Status followed by its State. Status is determined by Foglight for Storage Management as describe above. State refers to the physical state of a component as reported by the vendor; if the vendor does not provide the physical state, the state is unknown. A component’s physical state may affect its status only when an enabled rule triggers alarms based on state. Consult with your Foglight Administrator if you want to enable or create rules that perform this check. |
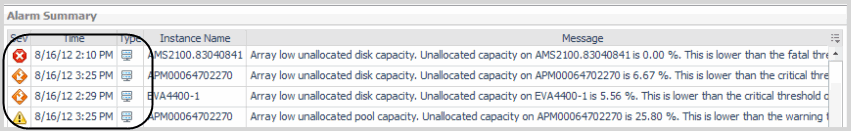
A storage device often has large numbers (thousands) of child components. With a few exceptions, alarms on child components do not change the status of the parent device. For example, a failed disk may have a Fatal status, but because arrays are designed to cope with a failed disk, the parent device continues to display a Normal status. The parent device status may be changed by child components in the following circumstances:
For information about changing default rules and alarm settings, see Managing Foglight for Storage Management Rules.
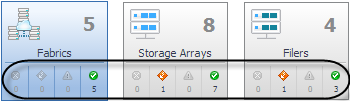
Use the Monitoring tab in the Storage Environment dashboard to gain a high-level understanding of the status of the devices in your environment, organized by device type. For a general description of the dashboard, see Introducing the Storage Environment Dashboard.
|
1 |
|
2 |
Click the Monitoring tab. |
|
• |
|
• |
|
3 |
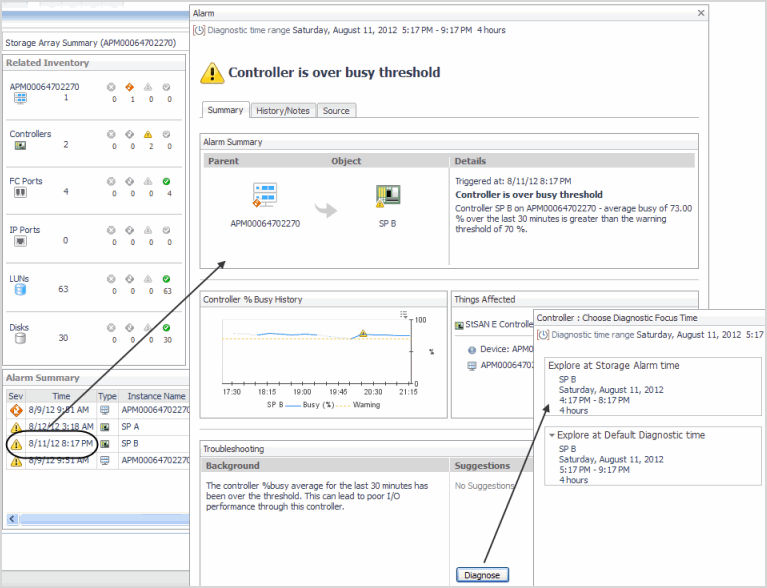
From the Troubleshooting pane, click the Diagnose button. |
|
• |
Explore at Storage Alarm time. Select this option when you want to view diagrams and other details of the affected component at the time the alarm occurred. Shows data for the time period leading up to and including the alarm time. For example, given an alarm time of 10:32 AM and the default four hour time range, the diagnostic time range is set to 6:32 AM – 10:32 AM. |
|
• |
Explore at Default Diagnostic time. Select this option when you want to determine if the situation causing the alarm persisted or if it resolved on its own. Shows data before and after the alarm, with the alarm time positioned three quarters of the way into the time range. For example, given an alarm time of 10:32 AM and the default four hour time range, the diagnostic time range is set to three hours before the alarm and one hour after the alarm, that is, 7:32 AM – 11:32 AM. If the current time falls within the range, for example, it is currently 11:05 AM, the time range is set to 7:32 AM – 11:05 AM. |
|
6 |
When you complete your investigation, in the breadcrumbs, click Storage Environment to return to the Choose Diagnostic Focus Time window. If desired, choose the other diagnostic time range. |
|
• |
Acknowledge. Continues to display the alarm, but it is marked as acknowledged until the alarm is triggered again. For example, for Warnings, an appropriate action may be to acknowledge the alarm and ignore it. |
|
• |
Acknowledge Until Normal. Continues to display the alarm, but it is marked as acknowledged until the affected component returns to the Normal status. This is useful when a component has failed and you want to know when it is replaced. |
|
• |
Clear. Deletes the alarm. Choose this option when the situation is resolved. |
|
TIP: When you close the window, the time range returns to the time range in use before your alarm analysis. If it does not, in the Time Range either click the Frozen Time Range |
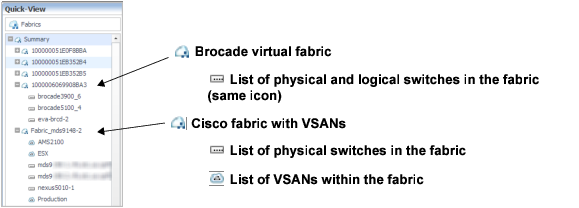
This walkthrough introduces the quick views for fabrics and their components.
|
1 |
On the Storage Environment dashboard, ensure the Monitoring tab is selected. |
|
2 |
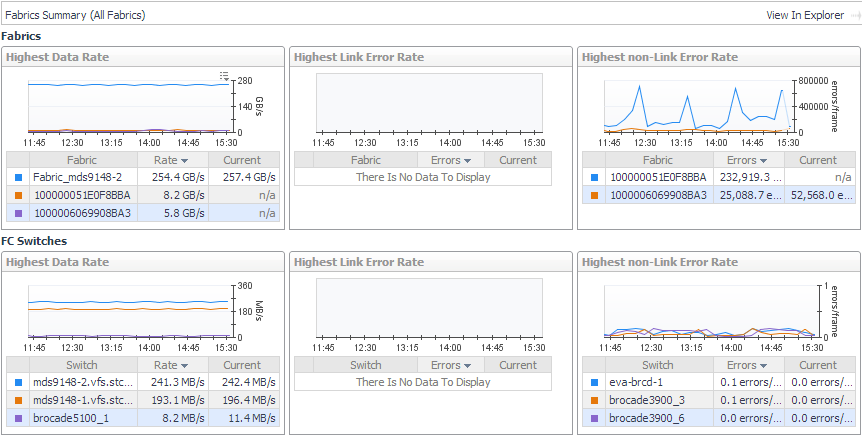
Click the Fabrics tile to open the Fabrics quick view. |
|
• |
|
• |
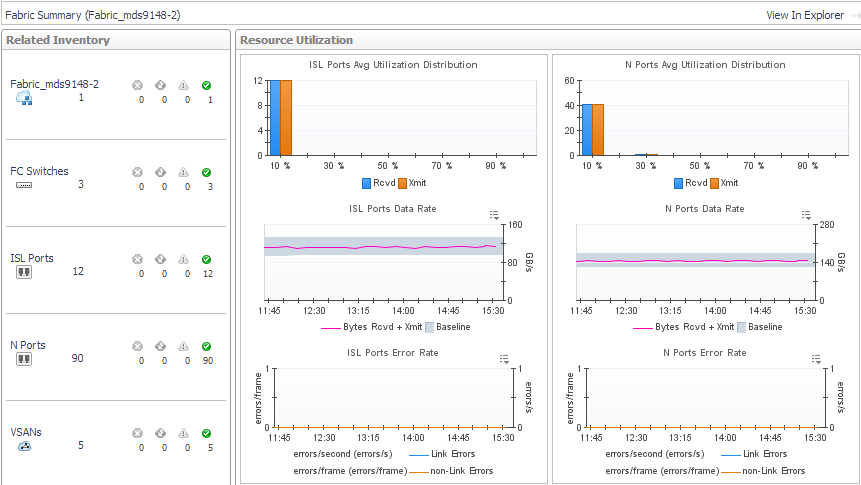
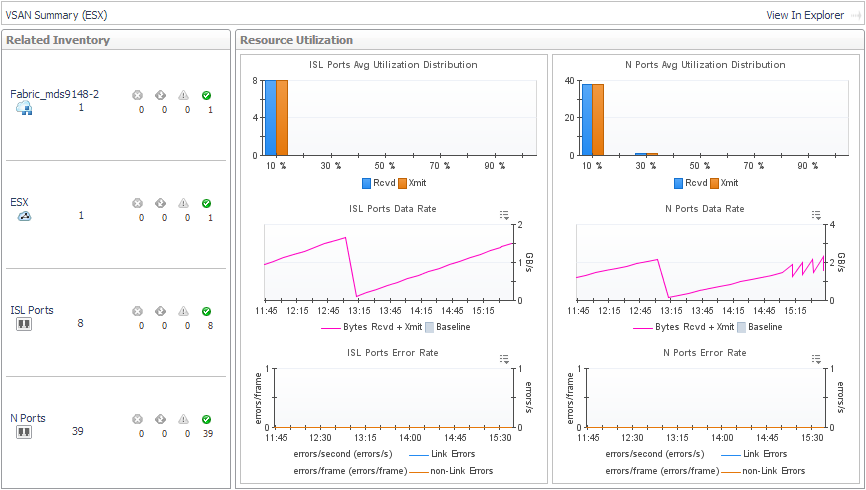
Avg Utilization Distribution. For each type of port, displays aggregated values for Rcvd Utilization and Xmit Utilization grouped by percentage of usage. Most of your port utilization should be in the lower percentages. When there are ports performing at high utilization rates, you may want to investigate port performance further. |
|
• |
Data Rate. For each type of port, plots aggregated values for Data Receive Rate and Data Send Rate over the time period and displays the Baseline. |
|
• |
Error Rate. For each type of port, plots aggregated values for Link Error Rate and Non-Link Error Rate over the time period. |
|
• |
To explore details about the fabric, its switches, and its ports, click View in Explorer. See Exploring a Fabric. |
|
• |
To explore an FC switch in the selected fabric, in the Related Inventory view click FC Switches or an alarm icon, and select a switch. See Exploring a Switch. |
|
• |
To investigate a port used in the selected fabric, in the Related Inventory view click either ISL Ports or N Ports or an alarm icon, and select a port. See Investigating an FC Switch Port. |
|
• |
Cisco fabrics only —To investigate a VSAN used in the selected fabric, in the Related Inventory view click VSANs or an alarm icon, and select a VSAN. See Exploring a Cisco VSAN. |
|
• |
To return to the quick view, in the breadcrumbs, click Storage Environment. |
|
• |
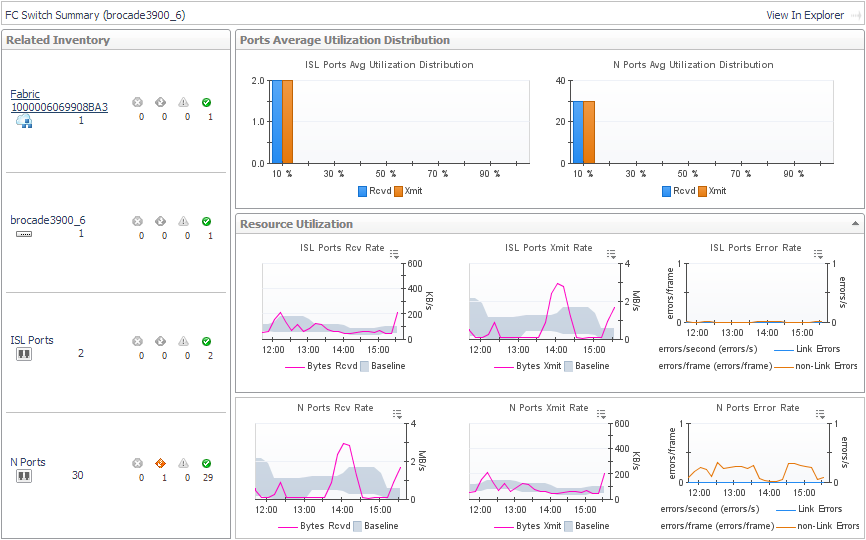
Ports Average Utilization Distribution. For each type of port, displays aggregated values for Rcvd Utilization and Xmit Utilization grouped by percentage of usage. Most of your port utilization should be in the lower percentages. When there are ports on the switch performing at high utilization rates, you may want to investigate port performance further. |
|
• |
Rcv Rate. For each type of port, plots aggregated values for Data Receive Rate over the time period and displays the Baseline. |
|
• |
Xmit Rate. For each type of port, plots aggregated values for Data Send Rate over the time period and displays the Baseline. |
|
• |
Error Rate. For each type of port, plots aggregated values for Link Error Rate and Non-Link Error Rate over the time period. |
|
• |
|
• |
To investigate a port used by the selected switch, in the Related Inventory view click ISL Ports or N Ports or an alarm icon, and then select a port. See Investigating an FC Switch Port. |
|
• |
To return to the quick view, in the breadcrumbs, click Storage Environment. |
|
• |
To explore details about the VSAN and its ports, click View in Explorer. See Exploring a Cisco VSAN. |
|
• |
To investigate a port used by the selected VSAN, in the Related Inventory view click ISL Ports or N Ports or an alarm icon, and then select a port. See Investigating an FC Switch Port. |
|
• |
To return to the quick view, in the breadcrumbs, click Storage Environment. |