Compare can be access from the Performance tree.
The upper panes graphically displays the Workload or any other selected resource.
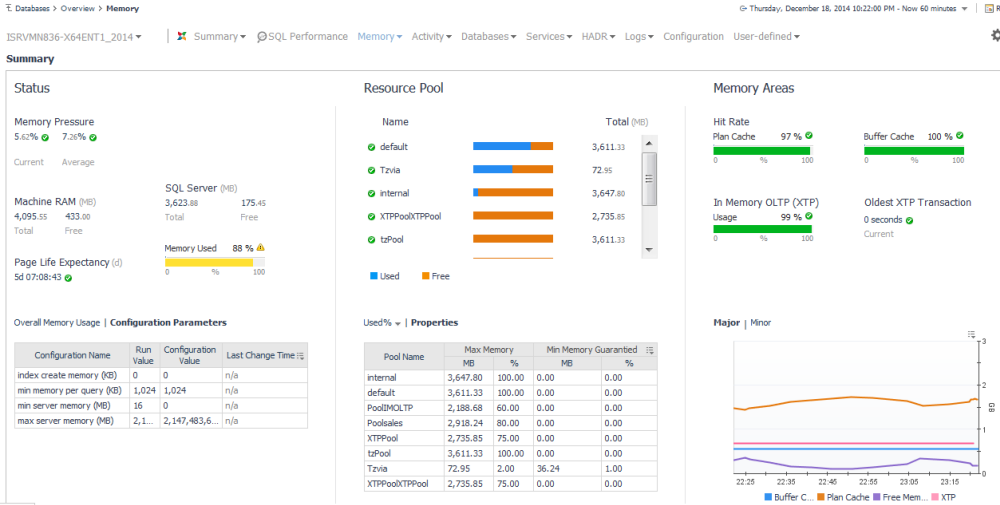
The Summary panel allows monitoring how the SQL Server instance is using its physical memory. This panel features charts that allow you to perform a full investigation of memory-related issues on the server.
The Summary panel 
Clicking on either of the Machine RAM or the SQL Server metrics allow you to investigate how these values changes over time.
Page Life expectancy is the length of time that a database page will stay in the buffer cache without references. A value too low for your system indicates that pages are being flushed from the buffer pool too quickly. The longer a page can stay in the buffer pool and be read from memory the better.
The Memory Used metric indicates the total percentage of dynamic memory, within the host's physical RAM, that the server is currently consuming.
Alerts regarding memory pressure may indicates that:
|
• |
The chart at the bottom of this section displays the metrics over time.