Investigating the collective use of all HMC resources
Your monitored PowerVM® servers are managed by the one or a pair of HMCs (Hardware Management Console). You can monitor the performance of HMC instances when you select the HMC tile on the Infrastructure Environment dashboard.
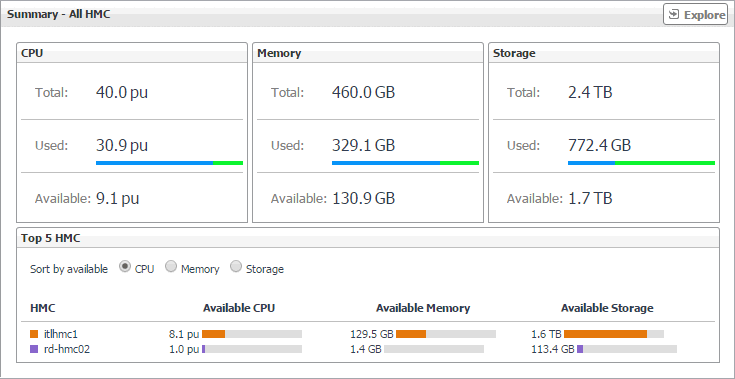
The Summary - All HMC view displays the levels of total, used, and available processor, memory, and disk resources for all HMCs in your integrated infrastructure. This view appears in the Selected Service PowerVM view when you select All HMCs in the HMC view on the left. It identifies the elements with the highest available levels of these resources.
|
The HMC instances that consume the highest amounts of processor, memory, and disk resources. | ||
|
Select processor, Memory, or Storage, to sort the list. | ||
Viewing HMC details
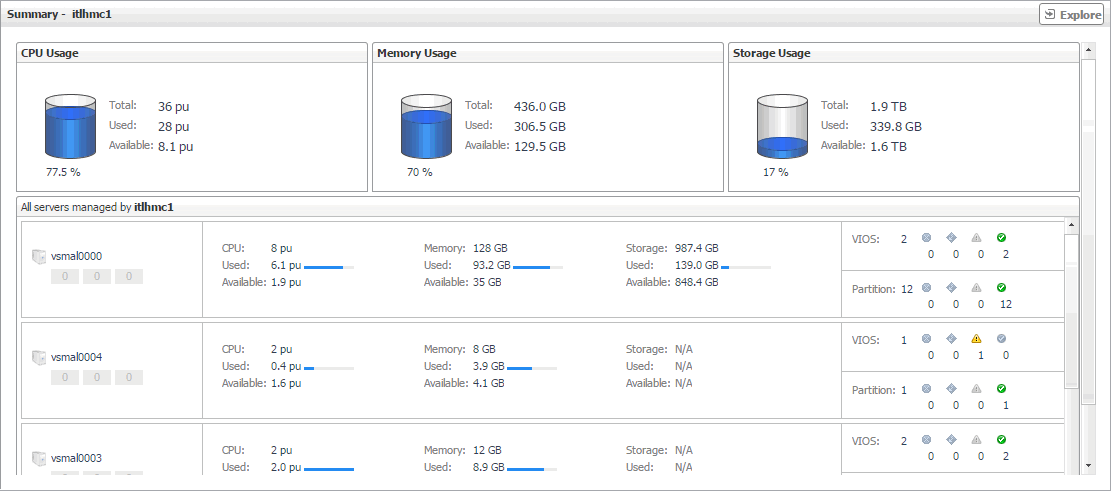
The HMC Summary view displays the resource utilization for all managed servers associated with the selected HMC instance. This view shows the levels of processor, memory, and disk usage for the selected HMC. The view appears in the Selected Service PowerVM view when you select the HMC tile, and then click an HMC instance in the HMC view.
Identifying top consumers of managed server resources
A managed server is a physical system managed by the PowerVM Hypervisor software layer. PowerVM Hypervisor divides physical system resources into isolated logical partitions. A managed server typically has multiple logical PowerVM partitions. You can monitor the performance of managed servers when you select the Managed Server tile on the Infrastructure Environment dashboard.
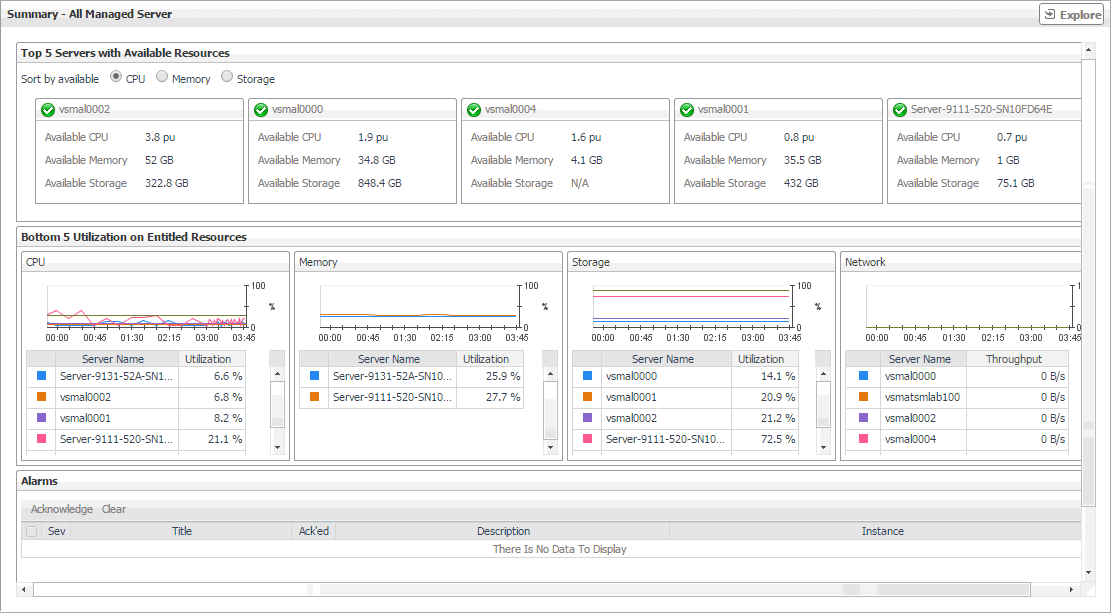
The Summary - All Managed Servers view identifies the top five servers with available processor, memory, and disk resources for each of theses categories. This view appears in the Selected Service PowerVM view when you select All Managed Server in the Managed Server view on the left. It recognizes the five managed servers with the lowest utilization of processor, memory, disk, and network resources that are allocated to them. Use it to quickly locate a managed server with available resources that can be allocated to new or existing logical partitions, when needed.
Viewing individual managed server details
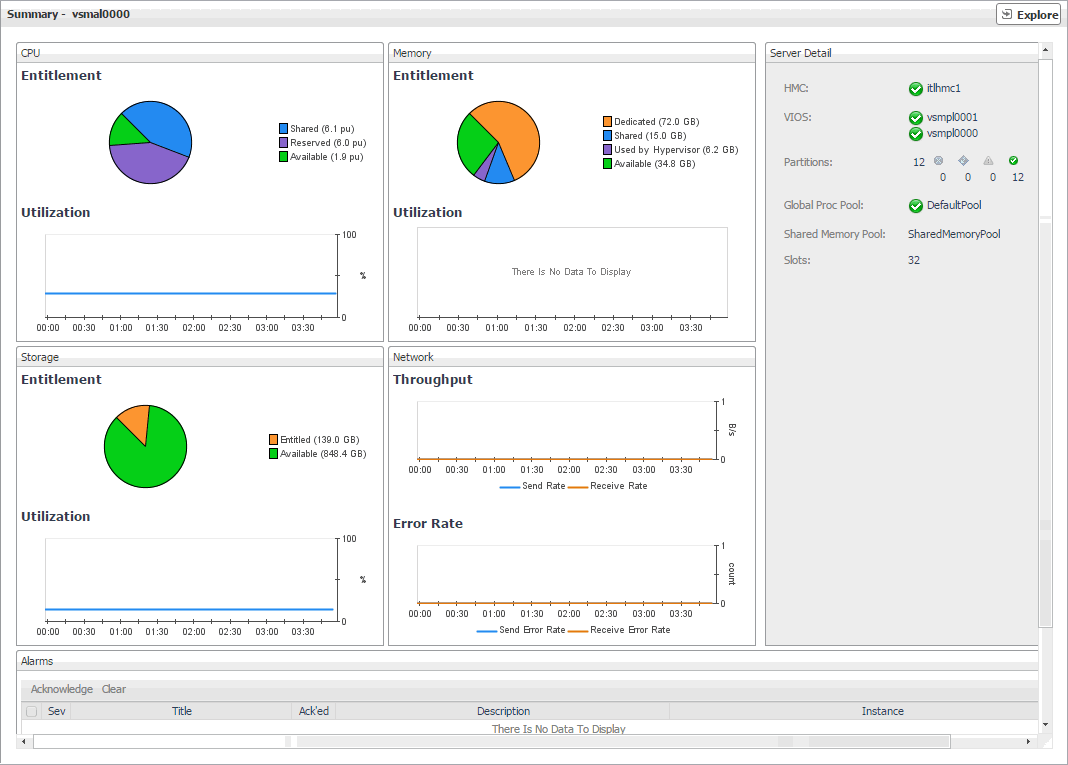
The managed server Summary view displays the resource utilization for the selected managed server. This view shows the levels of processor, memory, disk, and network usage. It also identifies the elements of your PowerVM infrastructure associated with the selected managed server, such as the HMC, VIOS, logical partitions, and others.
This view appears in the Selected Service PowerVM view when you select the Managed Server tile, and then click a managed server in the Managed Server view on the left. Use it to review the trends in usage of the Managed server's system resources, and to review any generated alarms, if they exist. For example, high peaks in the processor utilization chart could result in performance degradation and should be investigated.


