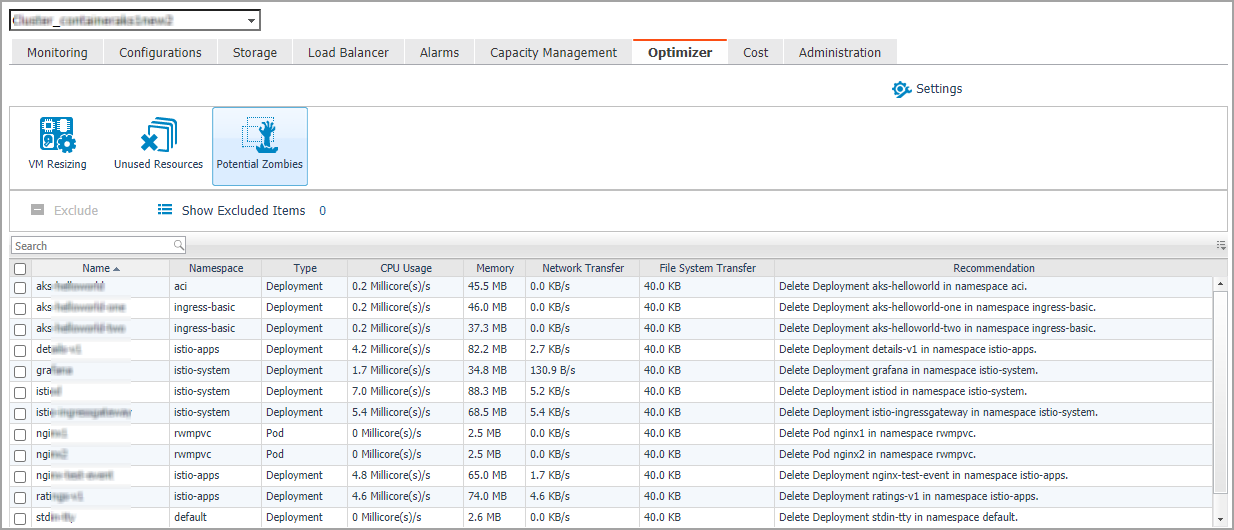
The Optimizer view appears after clicking Container > Kubernetes > Optimizer.
The Optimizer view includes the following elements:
|
• |
|
• |
Automate. Use the Automate menu to set the criteria for automatically sending recommendations for improvements. Currently, this button only functions for CPU and Memory when a VMware cluster is selected. |
|
• |
Reclaim Now and Reclaim Later buttons. System administrator can select a VM from the list and review the Reclaiming Savings bar for information about how many resources can be reclaimed. |
|
NOTE: The Reclaim Now and Reclaim Later buttons are enabled only after selecting a checkbox from the table. Currently, the two buttons only function for VM Resources, CPU, and Memory when a VMware cluster is selected. The Automate, Reclaim Now, and Reclaim Later buttons are displayed only when a VMware cluster is selected. |
|
• |
Exclude button. Select an object you want to exclude from the table to enable the Exclude button, and click Exclude. Then, this object is added to the list of excluded objects under a specific category. |
|
• |
Show Excluded Items button. Click the Show Excluded Items button to view the excluded objects. The Settings dialog box appears. For more information, see Excluded tab . |
|
• |
VM Resources/VM Resizing. Shows instance or virtual machine name, utilization, recommendations for both CPU and memory resources, and savings. |
|
• |
CPU. Shows instance or virtual machine name, utilization, recommendations for CPU resource, and estimated savings. |
|
• |
Memory. Shows instance or virtual machine name, utilization, recommendations for memory resource, and estimated savings. |
|
• |
Storage. Shows virtual machine name, utilization, storage and modify recommendations, and savings. |
|
NOTE: VM Resizing will be displayed when a cloud cluster is selected. VM Resources, CPU, Memory, and Storage will be displayed when a VMware cluster is selected. |
|
• |
Unused Resources table. Detects and shows those unused resources in container environment. |
|
• |
Potential Zombies table. Detects and shows the potential pod controllers in container environment, including Deployment, Daemon Set, Stateful Set, Replication Controller, as well as Pod that is not managed by any Pod Controller. |
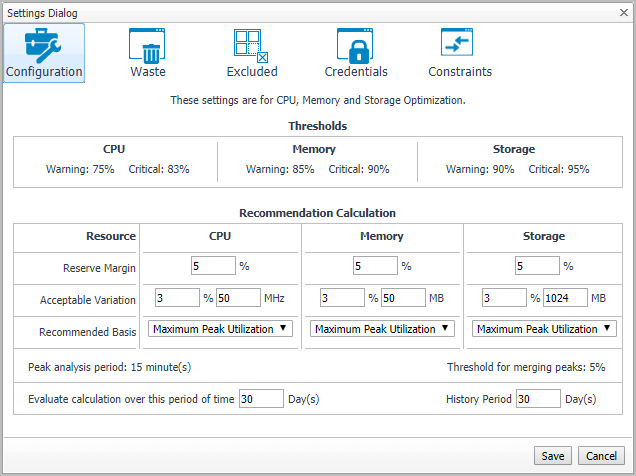
The Configuration tab provides the recommended settings for CPU, memory, and storage optimization.
|
• |
Thresholds. Provides the values of a resource metric that define the Warning and Critical levels (for CPU, memory, and storage). |
|
• |
Recommendation Calculation area. Allows you to define the following parameters for optimizing the CPU, memory resources in your environment, Storage resources not supported at current version: |
To save any changes made to the Configuration settings, click Save at the bottom of the tab.
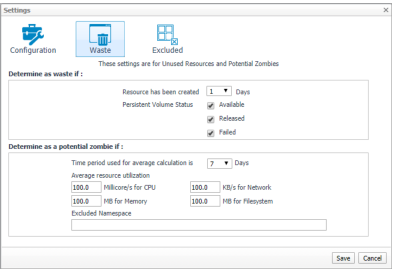
The Waste tab allows you to configure the settings for determining resources wasted in your environment. These include unused resources and potential zombie Pod controllers.
|
• |
Determine as waste if: used to filter Unused Resources. |
|
• |
Resource has been created [time] days: Resources that has been created more than the set days will be considered here. |
|
• |
Persistent Volume Status: By default, select Available and Failed. For detailed information, go to https://kubernetes.io/docs/concepts/storage/persistent-volumes/#phase. |
|
• |
Determine as a potential zombie if: used to filter Potential Zombies. |
|
• |
Time period used for average calculation is [time] days: The average metrics for the pods are calculated, so a time range should be set to calculate the average value. |
|
• |
Average resource utilization: only if a pod's metrics satisfy all the conditions, it will be considered to be a potential zombie pod. |
|
• |
Excluded Namespace: pods in the namespace can be excluded in the Potential Zombies check. |
To save any changes made to the Waste settings, click Save at the bottom of the tab.
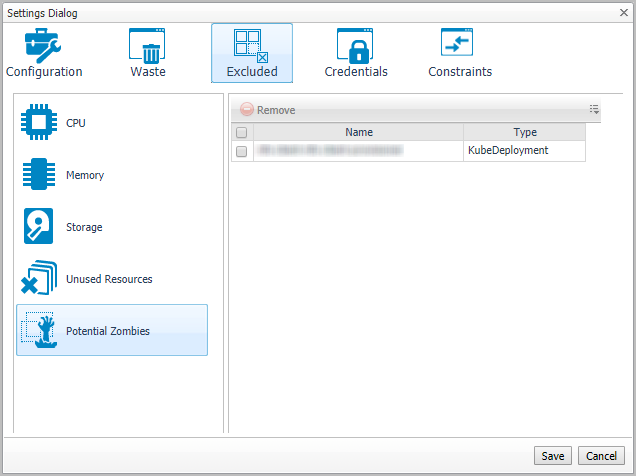
The Excluded tab allows you to remove a resource from the list of excluded objects. The Excluded tab includes the following information:
To remove resources from the list of Excluded objects, select the check boxes for these resources and click Remove. To save any changes made to the Excluded settings, click Save at the bottom of the tab.
The Excluded tab can also be accesses by clicking Show Excluded Items on the Optimizer tab.
This tab is available in VMware environment. The Credentials tab allows you to add, edit, and remove credentials groups. This tab is only for the Storage rightsizer.
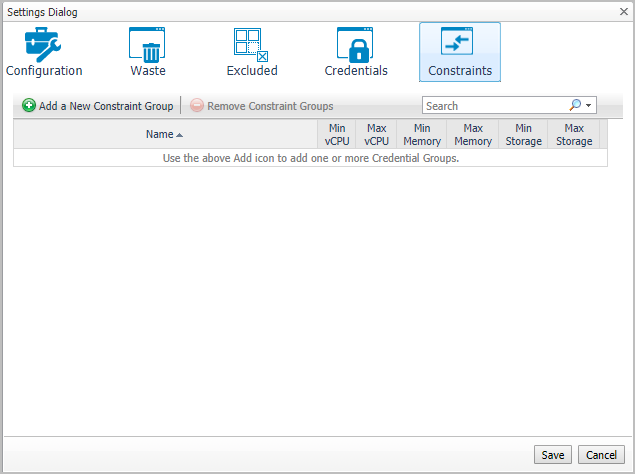
This tab is available in VMware environment. The Constraints tab allows you to set custom thresholds for select objects in the environment. These recommendations are displayed in the Optimizer tab > VM Configuration/ CPU/ Memory/ Storage views > Modify Recommendation column. Use this tab to add, edit, and remove constraints groups.
|
NOTE: The Administration dashboard can be accessed only when the users have both the Administrator role and the Container Administrator role. To grant the users with the Container Administrator role, go to Administration > Users & Security management under Administer Server > Manage Users, Groups, Roles > Roles tab. |
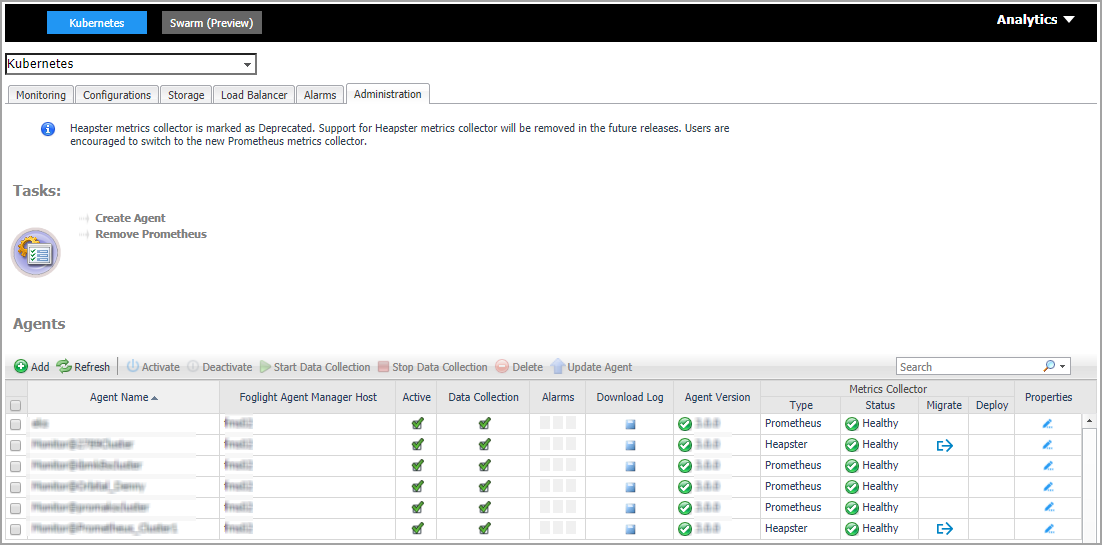
The Administration dashboard supports new agent creation and existing agents management. It contains the following features:
Use Create Agent or the Add button to start a wizard to create a new agent. See Creating and Activating a Kubernetes Agent for more information.
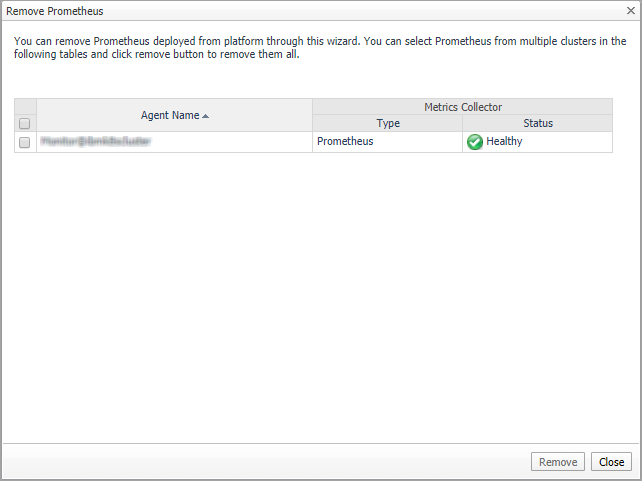
Remove Prometheus will start a wizard to remove the Prometheus successfully deployed through our platform.
Select the Prometheus you want to remove and click Remove.
If the Prometheus service is deleted successfully, a result message will be display. Otherwise, the Remove Prometheus wizard will appear again with error messages to guide you with further operations. Follow the messages and delete them again later.
Use Activate, Deactivate, Start Data Collection, Stop Data Collection, Delete, and Update Agent to manage the agent.
|
• |
Type: the type of Metrics Collector, supports Heapster, Prometheus, or OpenShift Prometheus. |
|
• |
|
• |
Discover failed: failed to discover the Kubernetes service in your cluster. The Deploy |
|
• |
Migrate |
|
• |
Deploy |
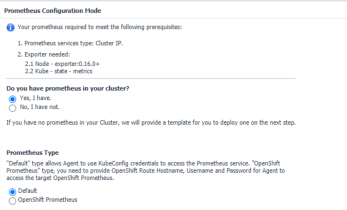
Clicking Migrate or Deploy
will launch the Configure Prometheus Metrics Collector Wizard.

|
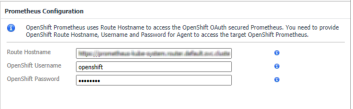
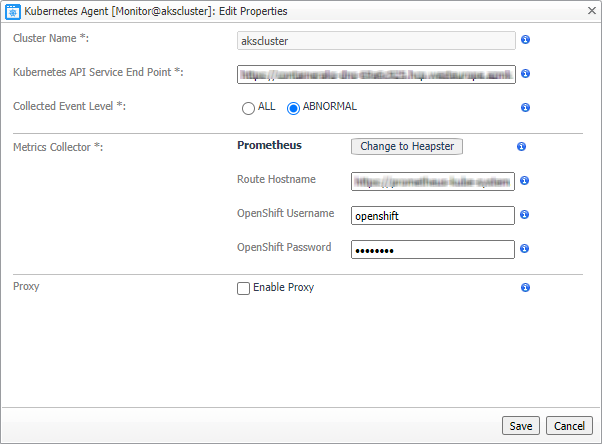
NOTE: To find the Route Hostname, go to the OPENSHIFT ORIGIN dashboard, Application > Routes. Your OpenShift Login User should have the privilege to access to the Prometheus. |
|
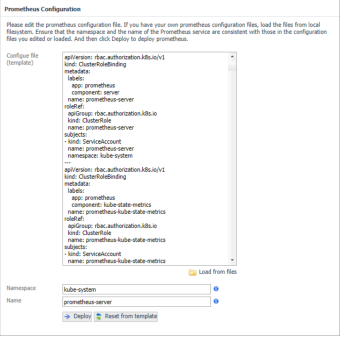
NOTE: Whenever you change the content in Configure file (template), ensure that the Namespace and Name fields are consistent with the Prometheus service configurations in your Configure file (template). If you are using the default template, there is need to change anything. |
|
• |
If deployed successfully, a succeeded message will be displayed. Close the Validation Result page and then click Next to finish your agent creation process. |
|
• |
If failed to deploy the Prometheus configuration, a Validation Result page will be displayed with possible solutions. |
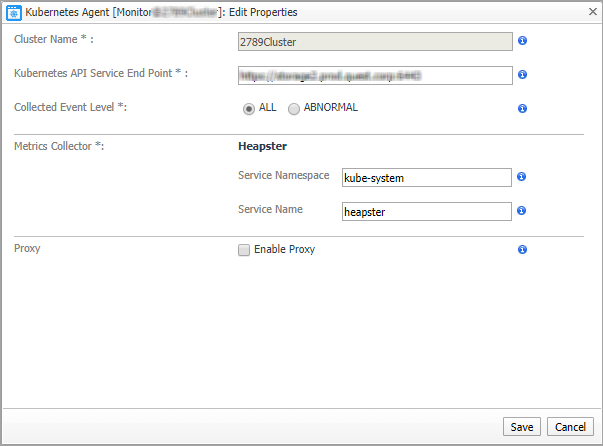
Click in Properties column of the Agents table to edit the property of the agent.
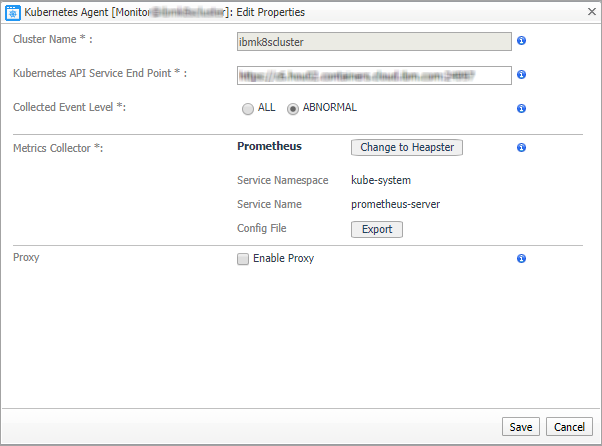
|
NOTE: If the Prometheus is deployed through our platform, the Service Namespace and Service Name cannot be updated through Kubernetes Agent Edit Properties wizard. You can use Remove Prometheus to remove Prometheus and deploy a new one. |

|
NOTE: If you are using your existing Prometheus as Metrics Collector, we will not help you to manage your Prometheus. Both the Service Namespace and Service Name can be updated in Kubernetes Agent Edit Properties wizard. |
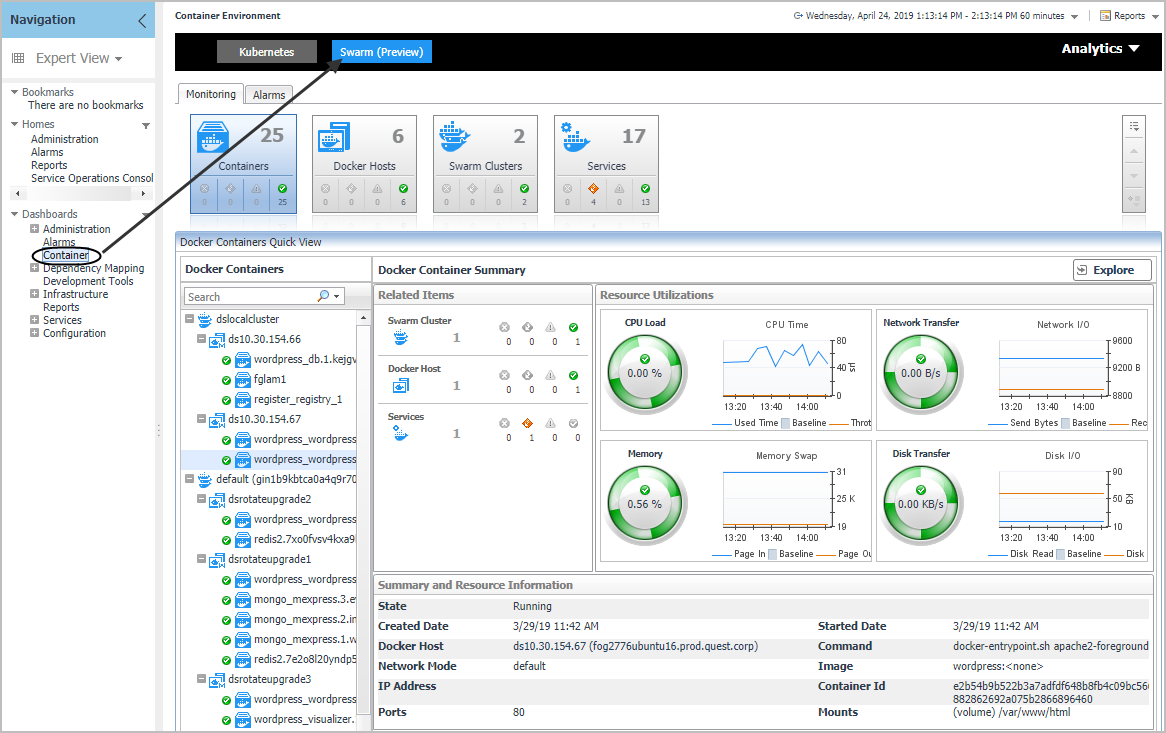
The Docker Container Quick View appears after clicking Monitoring > Containers. Click Swarm (Preview) from the header on top to switch to Docker Swarm dashboard.