This view consists of the following two panes:
|
• |
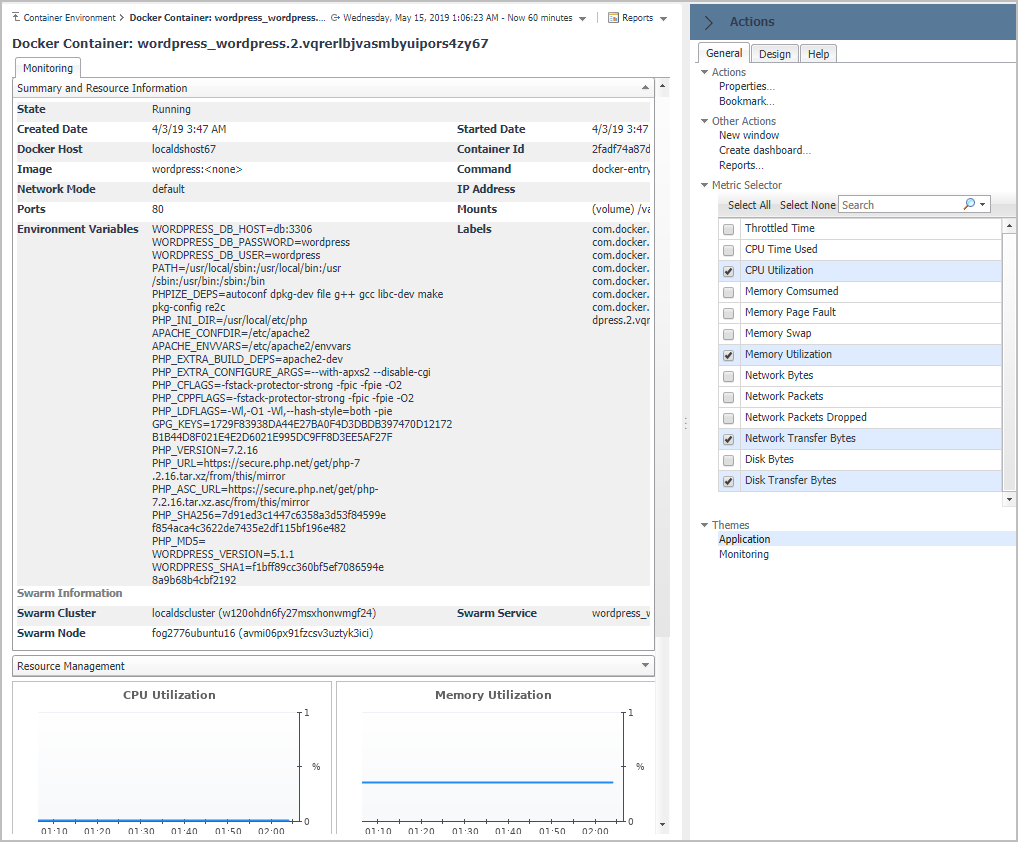
The Docker Containers tree view, which appears on the left of Docker Containers Quick View, lists the containers existing in the monitored Docker environment. The containers in the tree view are grouped by cluster > docker host > container. |
|
• |
The Docker Container Summary view, which appears on the right after you select an individual container in the Docker Containers tree view. |
The Docker Container Summary view appears on the right when you select a container in the Docker Containers tree view.
The Docker Container Summary view displays the following data:
|
• |
|
• |
Resource Utilizations: The resource utilization for the selected Docker Container over a selected period of time, which includes the following: |
|
• |
CPU Load: Shows the CPU utilization of the selected container. |
|
• |
Network Transfer: Shows the transfer bytes rate of the selected container over a selected period of time. |
|
• |
Memory: Shows the memory utilization of the selected container. |
|
• |
Disk Transfer: Shows the disk transfer bytes rate of the selected container over a selected period of time. |
|
• |
Summary and Resource Information: Displays the detailed information about the selected Container, including State, Command, Created Time, Started Time, Image, and so on. |
Click Explore on the upper right of the Docker Container Summary view to open the Container Explorer view, which shows more detailed information about this container.
The Container Explorer view opens when you click Explore in the Docker Container Summary view, which includes the following tabs:
This view consists of the following two panes:
|
• |
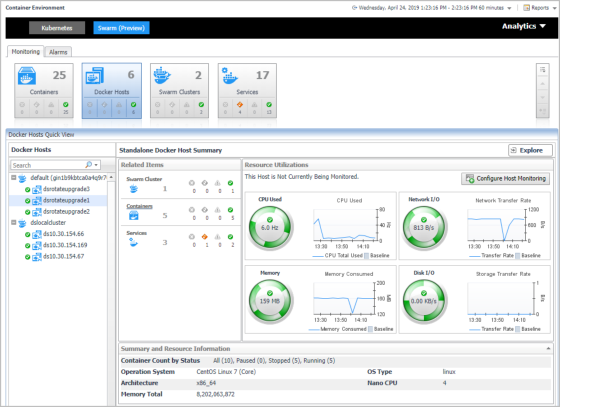
The Docker Hosts tree view, which appears on the left of Docker Hosts Quick View, lists the docker hosts existing in the monitored Docker environment. The docker hosts in the tree view are grouped by cluster > docker host. |
|
• |
The Docker Host Summary view appears on the right after you select an individual docker host in the Docker Hosts tree view. |
The Docker Host Summary view appears on the right when you select a docker host in the Docker Hosts tree view.
The Docker Host Summary view displays the following data:
|
• |
|
• |
Resource Utilizations: The resource utilization for the selected docker host over a selected period of time, which includes the following: |
|
• |
CPU Load: Shows the CPU utilization of the selected docker host. |
|
• |
CPU Used: Shows the used CPU resources aggregated from the containers running on the docker host. |
|
• |
Network I/O and Network Transfer Rate: Shows the transfer bytes rate of the selected docker host aggregated from the containers running on the docker host over a selected period of time. |
|
• |
Memory and Memory Consumed: Shows the memory consumed bytes aggregated from the containers running on the docker host. |
|
• |
Disk I/O and Disk Transfer: Shows the disk transfer bytes rate of the selected docker host aggregated from the containers running on the docker host over a selected period of time. |
|
• |
Summary and Resource Information: Displays the detailed information about the selected docker host, including Container Count by Status, Operating System, Memory Total, and so on. |
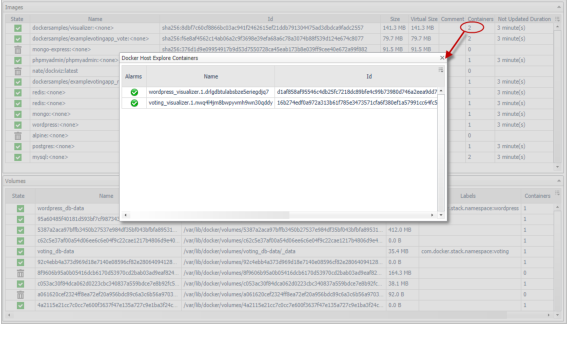
Click Explore on the upper right of the Docker Host Summary view to open the Docker Host Explorer view, which shows more detailed information about this container.
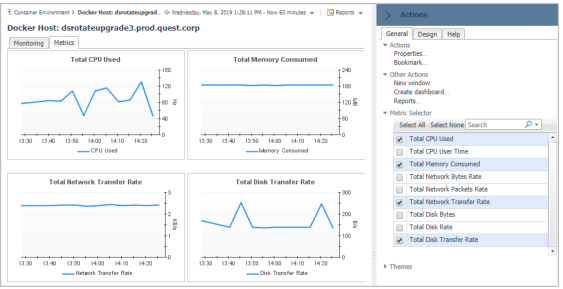
The Docker Host Explorer view opens when you click Explore in the Docker Host Summary view, which includes the following tabs:
|
• |
Monitoring tab: The Monitoring tab displays the overall information of the selected docker host over a selected period of time, including the Summary and Resource Information table, Containers table, Images table, and Volumes table. |

|
• |
Containers table: Includes the containers on this docker host. |
|
• |
Images table: Includes the images pulled onto this docker host. |
|
• |
Volumes table: Includes the volumes created on this docker host. |
|
• |
Metrics tab: The Metrics tab displays the Metrics list. To set the Metrics list displayed, go to Action > General > Metric Selector. For more information about the description of the metrics, see Container metrics . |