Database Overview
|
1 |
|
2 |
Choose the database type from the Choose a Foglight Server box. |
|
NOTE: If Choose a Foglight Server does not contain entries for Oracle or MS SQL Server, databases, you might need to grant additional permissions to the database user. For more information, see Grant permissions to explore database activities. |
|
• |
|
• |
To populate the database charts that are available for Oracle and Microsoft SQL Server on the navigation panel under Dashboards > Management Server > Servers > Database Overview, you need to grant the special permissions on the back-end database for the Foglight Management Server. For a MySQL or PostgreSQL database, special permissions are not required.
Where fmsdbuser is the name of the Foglight database user, as defined by the foglight.database.user parameter in <Foglight_home>/config/server.config.
Persistence Handler Overview
|
1 |
On the navigation panel, under Dashboards, click Management Server > Servers > Persistence Handler Overview. |
Data Management
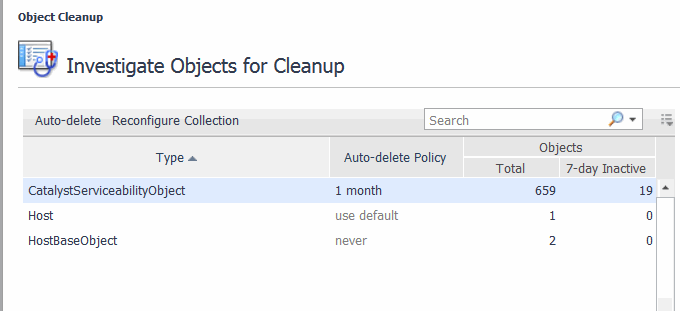
Foglight builds topology models at run-time using the data collected from your monitored systems, and keeps information related to monitored types indefinitely. Global Default setting can be used so objects are not kept indefinitely. Objects that are not expected to change or update are considered stale. These stale objects consume monitoring resources and can be cleaned up. If you have a very large number of stale objects, this may indicate a misconfiguration of your monitoring environment.
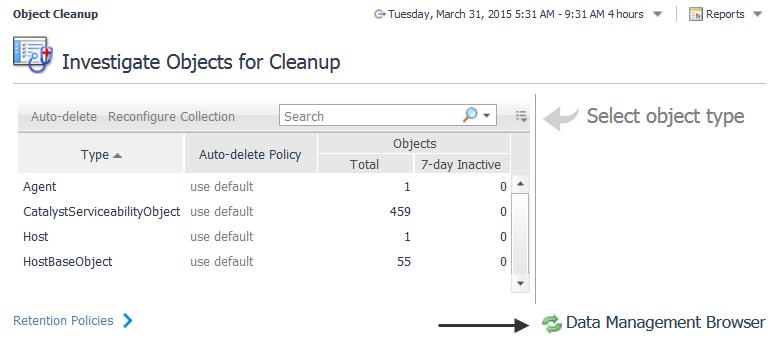
Use the Object Cleanup dashboard to remove stale objects, and to reconfigure your URL transformation rules if necessary.
|
• |
On the navigation panel, under Dashboards, click Management Server > Servers > Object Cleanup. |
|
2 |
|
IMPORTANT: After you type a new number in the since box, you must press Apply to ensure the value is updated. |
|
IMPORTANT: After you type a new number in the since box, you must press Apply to ensure the value is updated. |
|
9 |
|
2 |
Click Auto-delete. |
|
5 |
Click OK. |
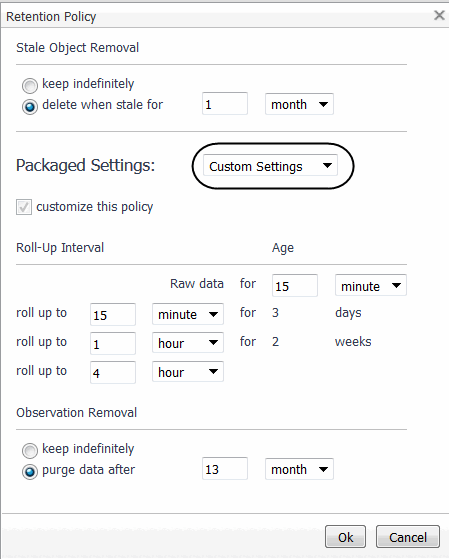
You can also navigate to an advanced dashboard to set rollups per object, using the Manage Retention Policies dashboard in the Administration module. For more information, see Manage Data Retention.
To create a custom retention policy:
|
1 |
|
2 |
|
4 |
Click Ok. |
|
1 |
|
2 |
Click the Data Management Browser link in the bottom right-hand corner. |
Use the Delete, Purge for objects, or Purge for types options in the header of the table to manage data objects.
Delete — Use this option to immediately delete the object, the object metric, or delete the object tree. You can choose whether to delete an object individually or delete its tree and also choose whether or not to delete the metrics associated with an object. For example, if you choose to delete a host, all data associated with the host is deleted.
Purge for objects — Use this option to schedule the removal of the observations for a selected object during the database off-hours maintenance cycle. By default, this maintenance is scheduled at the end of the month. For more information, see Purge data objects.
Purge for types — Use this option to schedule the removal of objects by types during the database off-hours maintenance cycle. By default, this maintenance is scheduled at the end of the month. For more information, see Purge data objects.
|
1 |
|
2 |
Click the Data Management Browser link in the bottom right-hand corner. |
|
5 |
|
7 |
Click Set. |
|
1 |
|
2 |
Click the Data Management Browser link in the bottom right-hand corner. |
|
4 |
|
5 |
Click Yes to the confirmation message Are you sure you want to delete this object and all of its children?. |
Management Server View and Management Server Metrics
|
1 |
On the navigation panel, under Dashboards, choose Management Server > Servers > Management Server View. |
|
2 |
Click Choose a Foglight Server and select the server from one or more list entries that appear. |
|
• |
Rule Service: Shows the number of rule and derived metric instances bound to data objects. |
|
• |
Data Service: Shows the ability of the server to keep up with incoming data. |
|
• |
JVM: Shows the memory performance of the JVM in which the server is running. |
|
• |
JDBC Connection Pool: Shows the number of database connections that are in use or available at any time. |
|
• |
Derivation Service: Shows the number of derivation rulettes, errors, and evaluation counts. |
|
• |
Email Sender Service: Shows the number of emails that are sent from the selected Management Server. |
|
• |
FMS Database Size: Shows the size of the database. |


