A Cost/Benefit Chart enables allows you to compare properties you class as Costs in your organization against properties you class as Benefits.
The result is a type of color-coded bar chart which highlights the costs and benefits, as well as a calculated cost/benefit value.
There is no limit to the number of cost and benefit properties you use, but obviously the more you do use, the more unusable the chart will become.
|
|
Cost/Benefit Charts require that you have Whole Number or Decimal Number properties for your Costs, and either Whole Number, Decimal Number of Drop-down properties for your benefits. If you do use Drop-down properties for benefits, these should include a number, such as: 1 - Low 2 - Medium 3 - High You can have multiple costs and multiple benefits on one chart. |
|---|
Why and how should you use one?
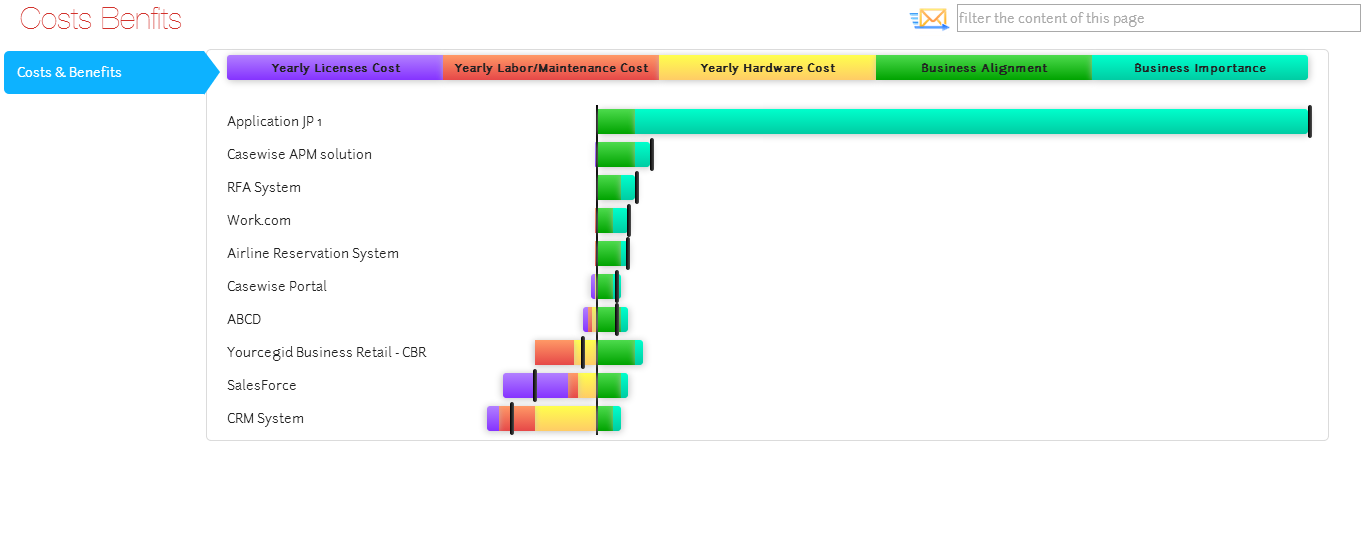
An example of using a Cost/Benefit Chart might be to show the business benefit of expenditure on software applications.
A number property could be used to store the actual monetary cost of the application in your organization, while a drop-down could be used to assign the importance of the application to the business - from 1 to 10.
Using the chart, you would then be able to get an overview as to whether you were spending a lot of money on applications that have little business value.
Where and when can you use one?
Use the table below to see where you can use a Cost/Benefit Chart:
|
Page Type |
Parent node |
Tabs |
Number on page |
Editable |
|---|---|---|---|---|
|
Index Page |
Object Type node |
Yes - optional |
1 The Chart must be the top-most item on the page |
No |
What do you want to do?
Create a new Cost/Benefit Chart
To create a new Cost/Benefit Chart for your page:
Ensure the Layout node for your element is set to Empty
Right-click the Layout node and choose Add Behaviors > Other Charts > Cost - Benefit Chart
A Cost-Benefit Chart node is added below the Layout node.
Select the Cost-Benefit Chart node and set the properties.
In the Costs area, select the properties you want to use as costs on the chart.
In the Benefits area, select the properties you want to use as benefits on the chart.
Use the Multiplier field to enter the multiplier number for equalizing calculations.
|
|
Costs tend to have higher values than those you assign to determine benefits such as business importance. For example a cost might be 10,000, but the business importance might be 3 - High. The Multiplier can be used to set a value to multiply the benefits by so they can be brought into line with the costs for comparison. |
|---|
Right-click the Object Type node and choose to add a New Property Group
Use New Property Group > Empty Group or From CM Panel depending on your preference.
See Working with Property Groups for more details on Property Groups.
Select the Property Group and use the Selected Properties area to choose all the cost and benefit properties you want to reference on the chart
Save your Site.
The Site is saved and the Cost/Benefit Chart is created.


