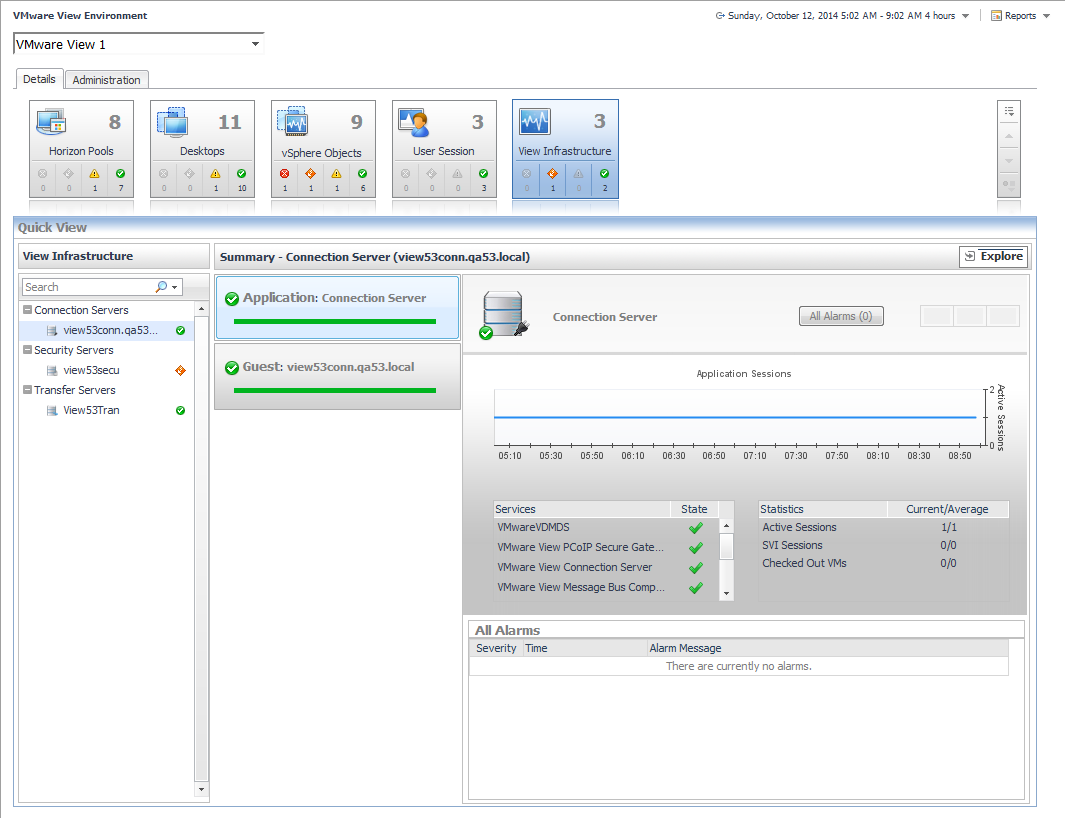
Click the Explore link in the upper-right corner to drill down to the VMware Explorer view of the object, to see detailed information about the selected object and its components. If the selected object is a monitoring VM, the VMware Explorer page appears. For further information, see Use the VMware Explorer. If the selected object is a host, the Host Monitor page appears.
|
NOTE: The Explore link applies to infrastructure components only. The components that appear in the User Session tile have their own Explore link. For more information, see Explore user sessions. |
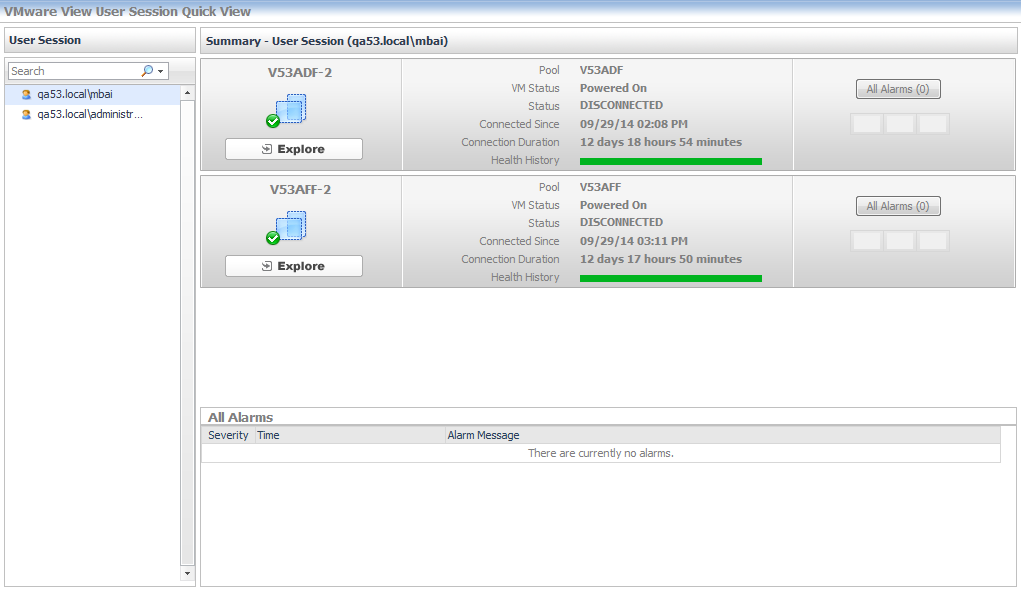
When you click the User Session tile, a list of the connected users is shown in the Quick View. Selecting a user from the Quick View displays the session types for the user, and a summary of the session details depending on the session type. Each user will have one or more sessions in a View instance.
An Explore link is located below the icon of the session type. Click the link to view detailed information about the session type.
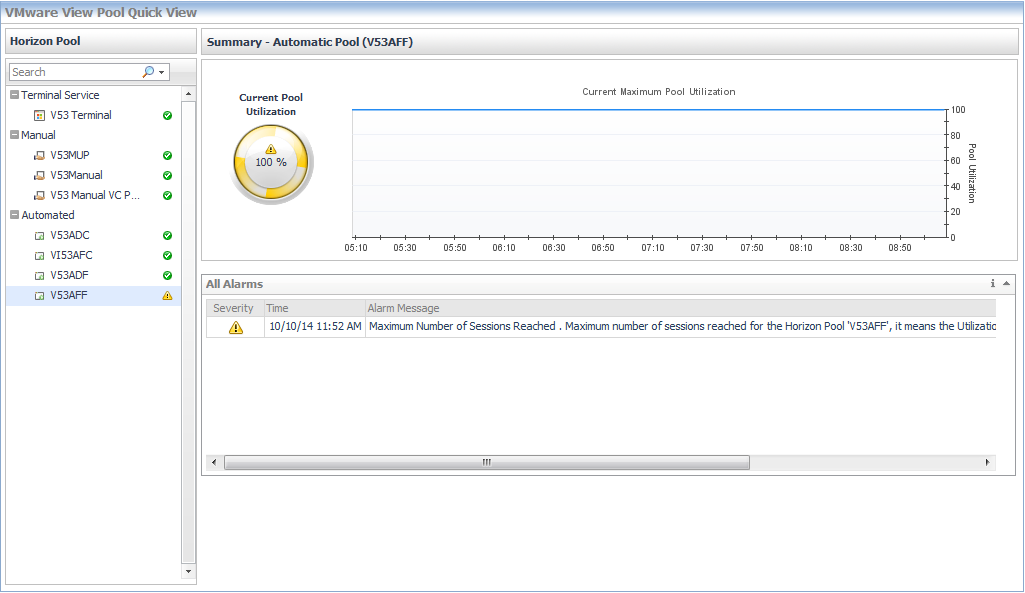
The All Alarms table at the bottom of the view shows all the alarms triggered for the user session.
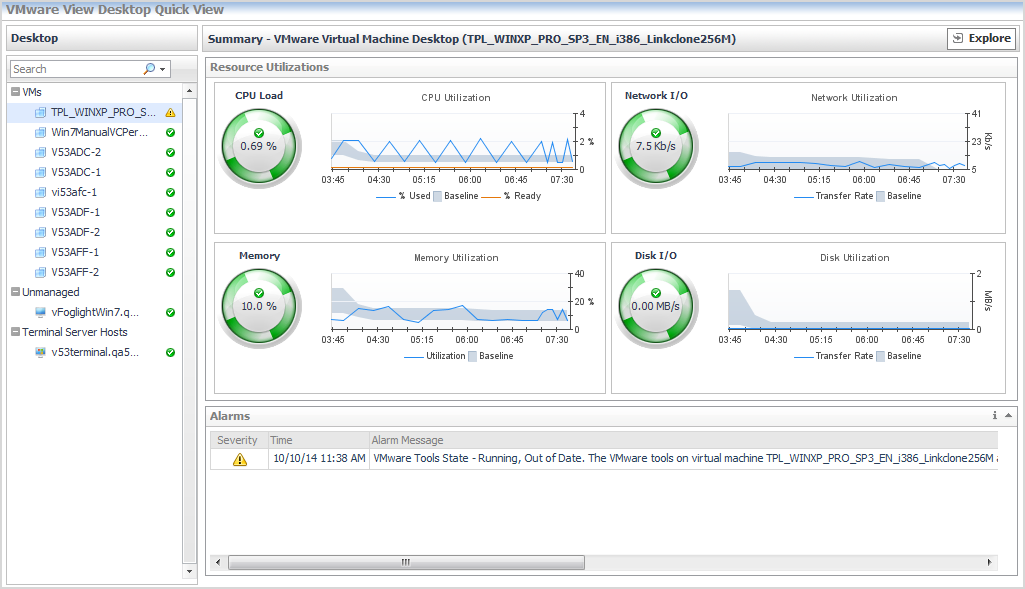
When you click the Desktops tile, a list of Virtual Machines, Terminal Service Hosts, and Unmanaged Desktops on Physical Hosts is displayed in the Quick View.
Selecting a Virtual Machine from the Quick View list displays the resource utilization values for that VM in the Summary pane. Click the Explorer link in the upper-right corner to drill down to the VMware Explorer view of the object, to see detailed information about the selected object and its components. If the selected object is a monitoring VM, the VMware Explorer page appears. For more information, see Use the VMware Explorer.
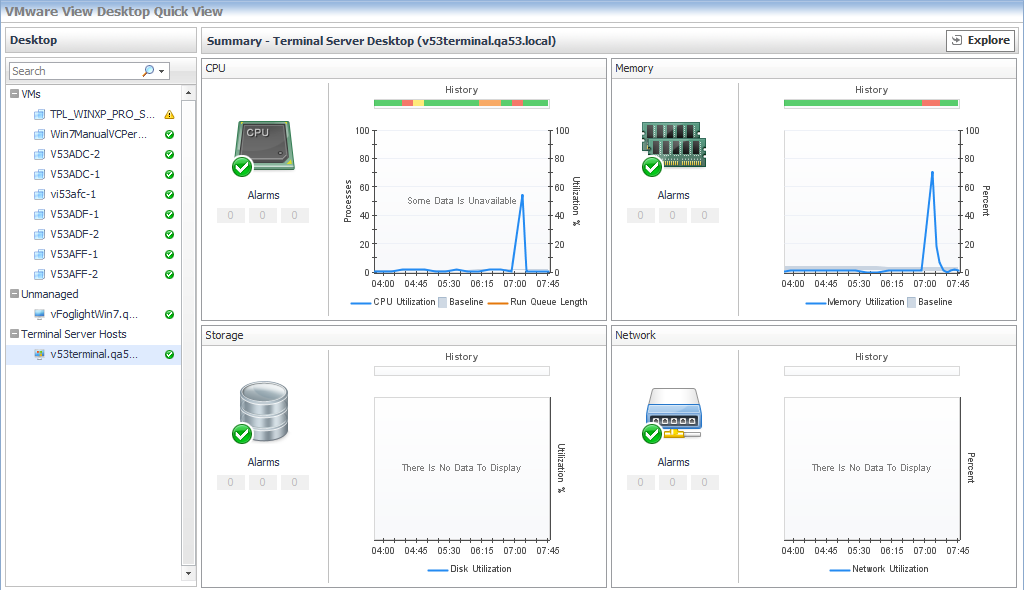
Selecting a Terminal Service Host or an Unmanaged Desktop on Physical Host from the Quick View list displays the CPU, Memory, Network, and Storage utilization charts for the selected host in the Summary pane. Clicking any data series on the charts allows you to drill down into the Metric Analyzer dashboard for the associated metric and view the metrics collected for that topology object. Click the Explorer link in the upper-right corner to drill down to the Host Monitor page for the selected host.
When you click the Horizon Pools tile, the Quick View shows a list of pools available in the View Instance. The pools are grouped by type: Automated, Manual, and Terminal Services.