Tchater maintenant avec le support
Tchattez avec un ingénieur du support

Foglight for Exchange 6.0.0 - User Guide

Navigation basics Exploring the Foglight for Exchange dashboards Managing Exchange agents Reporting on your Exchange environment Foglight for Exchange views
Role views Exchange Server views Site views Cluster views Description of Embedded views
Agent State view Alarms view Auto Attendant Calls view Auto Attendant Directory Access view Auto Attendant General view Auto Attendant Transfers view Cached LDAP Searches/sec view CAS AB Load view CAS AB Service view CAS Control Panel Load view CAS Load view CAS OAB Download view CAS RPC Client Access view CAS RPC Client Access Load view CAS RPC HTTP view Client Access Features view Cluster Database Details view Cluster Storage Group Details view Cluster Summary and Resource Information view Cluster Summary view Clusters Listing view CPU view Disk view Domain Controllers view Edge Agent view Edge Transport Features view Exchange Roles Server Summary view Exchange Server Roles view (reference information) Exchange Servers in This Cluster view Exchange Servers view (Exchange Cluster Environment Summary) Exchange Servers view Host Monitor view Hub Transport Features view IP Address view Mailbox Features view Mailbox Store Assistant view Managed Availability Recovery Action Results view Memory view Network view Processes LDAP Read Time view Resource Utilization view Roles Listing view Roles Explorer view Role Features State view Roles Top 3 view Server Health view Server Listing view Servers in Site view Servers In This Site view Site By Category view Site Listing view Store Calendar Attendant view Store Client Search view Store Content Indexing view Store Database view Store Public Load view Store Resource Booking view Store RPC Client Throttling view Store Transport view Store User Load view Summary and Resource Information view Top 3 CPU Consumers view Top 3 Memory Consumers view Top 3 Network Consumers view Top 3 Storage Consumers view Total LDAP Read Time On All DCs view Total Long-Running LDAP Operations On All DCs view Transport Dumpster view Transport Edge Sync view Transport Extensibility Agent view Transport Load Store Drivers view Transport Queues view UM Availability view UM Call Answer General view UM Call Answer view UM Fax view UM General Current view UM General view UM Subscriber Access Calendar view UM Subscriber Access Directory view UM Subscriber Access General view UM Subscriber Access Message view Unified Messaging Features view Windows Services view
Foglight for Exchange rules Running diagnostic tests Managing Exchange metrics

Navigation basics

This guide has been prepared to assist you in becoming familiar with Foglight for Exchange. It provides basic navigation techniques, describes the dashboards, views and reports included with Foglight for Exchange, and provides information about the rules that are available for your monitored system.

This section describes the basic techniques used to navigate through Foglight for Exchange. It is intended to introduce you to the layout of the Foglight user interface and how to navigate through the dashboards and views provided with Foglight for Exchange:

For more information about Foglight navigation, see the Foglight User Guide or online help.

Foglight browser interface panels

Depending on who you log in as, you may see either the contents of the first bookmark (the Welcome page is the default) listed under Bookmarks, or a home page. For further details about these Foglight pages, see the Foglight User Guide or online help.

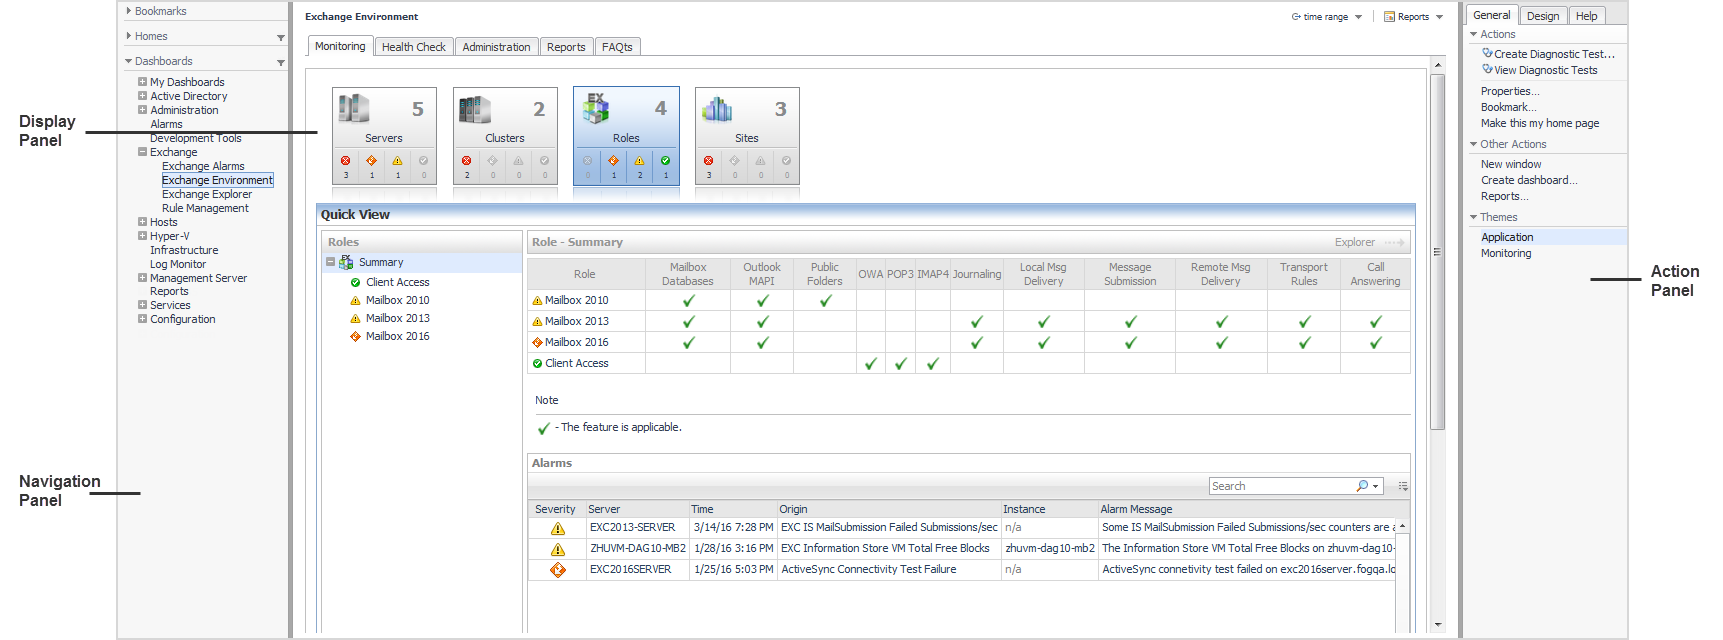
Typically the browser interface is divided into three panels:

Navigation panel

The navigation panel, at the left of the browser interface, operates like a drawer and is open by default. To close the navigation panel, click the arrow to the far left of the Foglight browser interface. Click the arrow again to open the navigation panel.

The navigation panel contains an expandable view of all the dashboards available to the current user. To access a specific dashboard, open the appropriate module (for example, Exchange) and select the dashboard to view it in the display panel.

The navigation panel also provides access to the Foglight Administration and Configuration areas, and may provide access to some cartridge-specific navigational views (for example, the Exchange Infrastructure view for the Exchange Explorer dashboard.)

If you do not see any dashboards in the navigation panel, the user ID with which you signed in may not have been assigned to a group. For details, see the Foglight User Guide or online help.

Display panel

The display panel is the large panel in the middle of the browser interface and is used to view current dashboards and reports, as well as to create new dashboards and reports. You can increase the size of the display panel by resizing the navigation panel, or if open, by closing the action panel.

Outils libre-service
Base de connaissances
Notifications et alertes
Support produits
Téléchargements de logiciels
Documentation technique
Forums utilisateurs
Didacticiels vidéo
Flux RSS
Nous contacter
Obtenir une assistance en matière de licence
Support Technique
Afficher tout
Documents connexes

The document was helpful.

Sélectionner une évaluation

I easily found the information I needed.

Sélectionner une évaluation