
Understanding Foglight for Container Management
About Foglight for Container Management
Architecture
Sizing Your Monitored Environment
Using Foglight for Container Management
Foglight Management Server Requirements
Kubernetes Agent Requirements
Docker Swarm Agent Requirements
Getting Started
Kubernetes
Reference
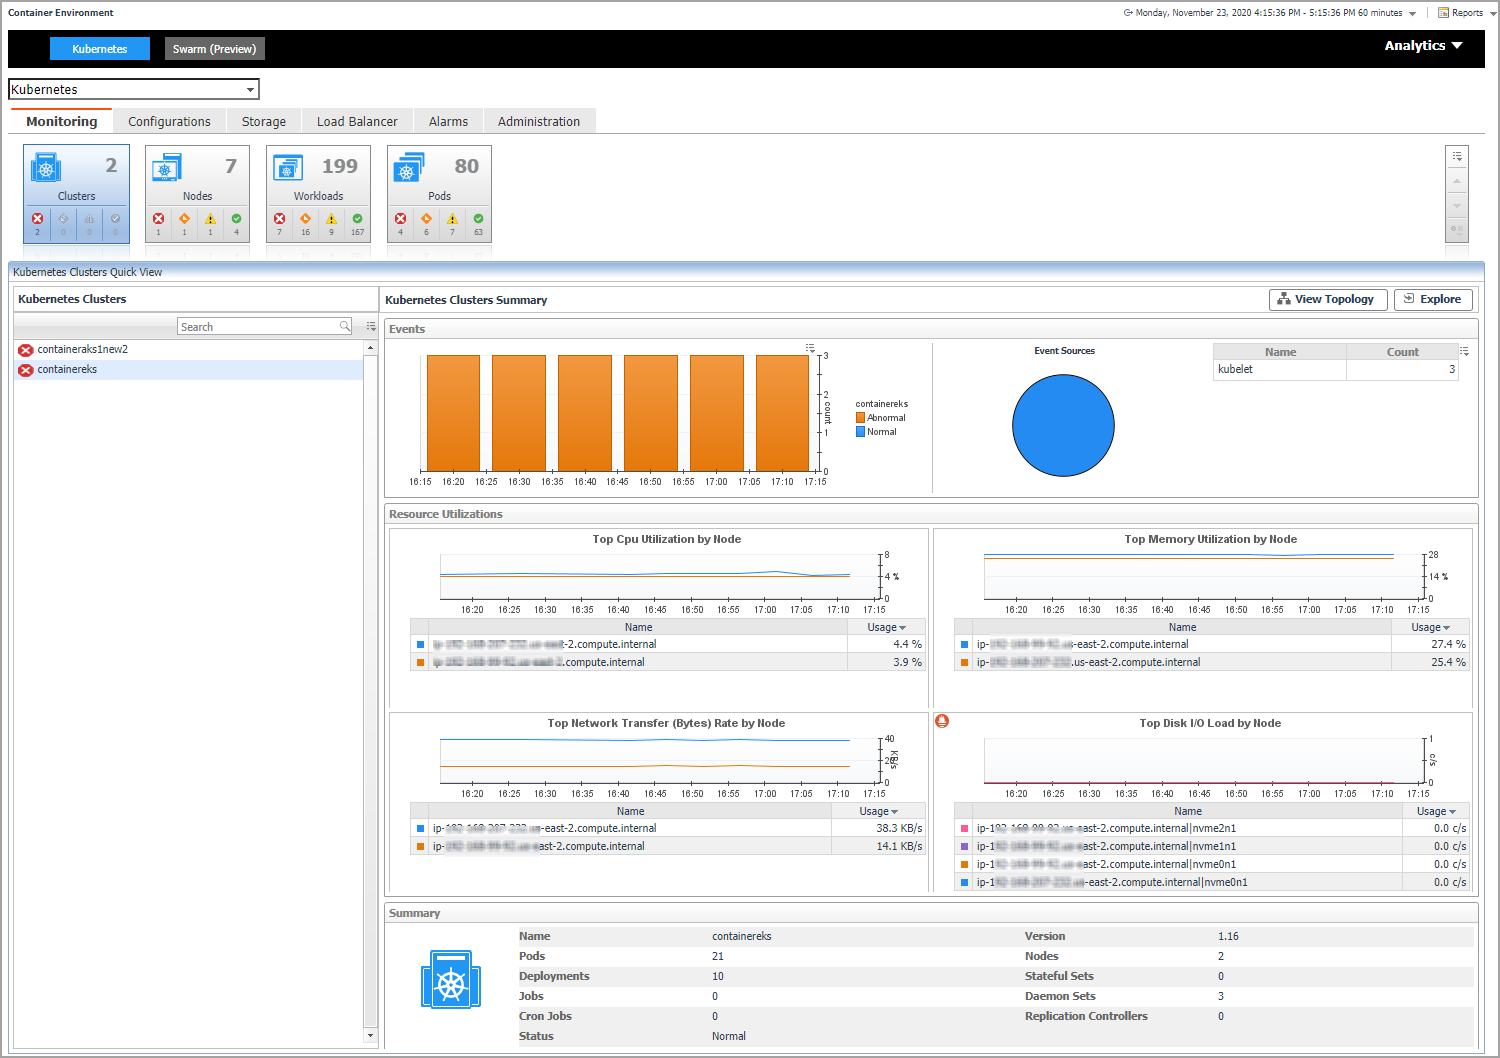
Monitoring Kubernetes Clusters
Monitoring Kubernetes Nodes
Monitoring Kubernetes Workloads
Monitoring Kubernetes Pods
Monitoring Kubernetes Other Components
Alarms
Capacity Management
Cost
Optimizer
Administration
Docker Swarm
Monitoring Docker Containers
Monitoring Docker Hosts
Monitoring Docker Swarm Clusters
Monitoring Docker Swarm Services
Alarms
Analytics
Domains and Object Groups
Creating and Activating a Kubernetes Agent
|
2 |
On the navigation panel, from Standard View click Container Environment or from Expert View click Dashboards > Container. Then the Container dashboard will display as below. |
|
3 |
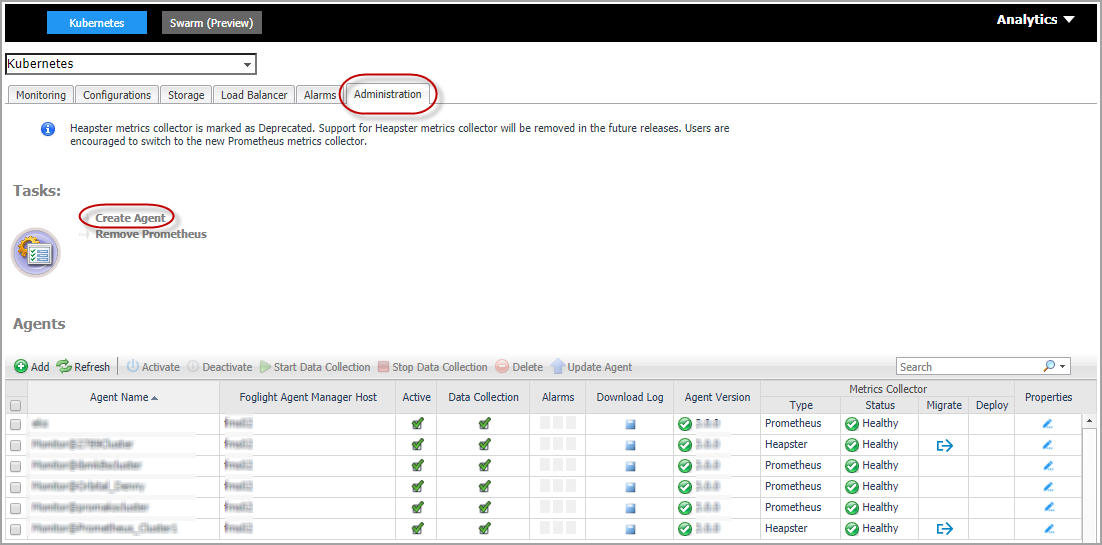
In the Container dashboard, click Administration tab, and then click Create Agent. The Create Docker Agent wizard opens. |
|
4 |
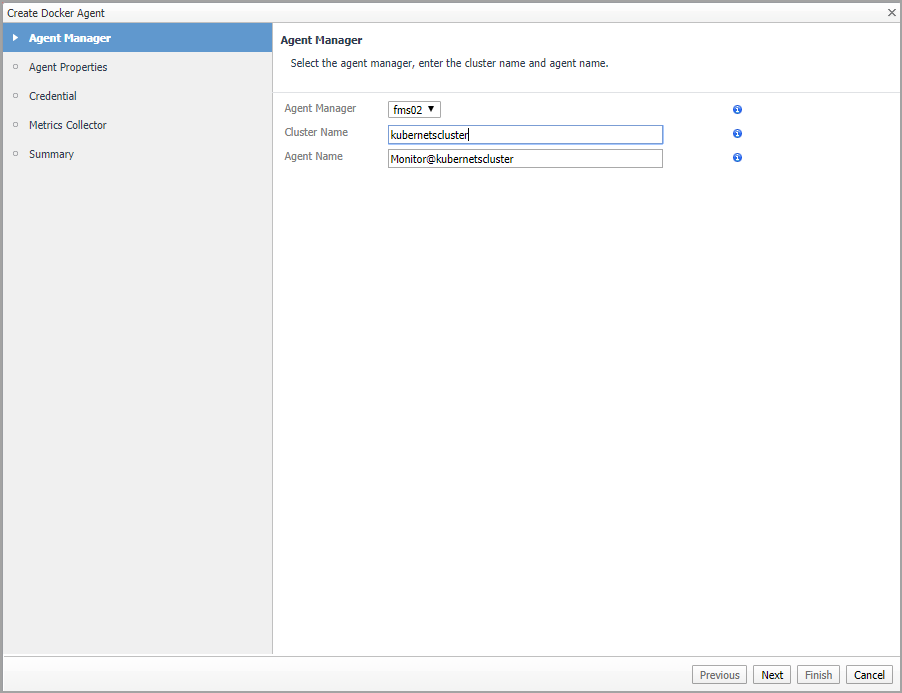
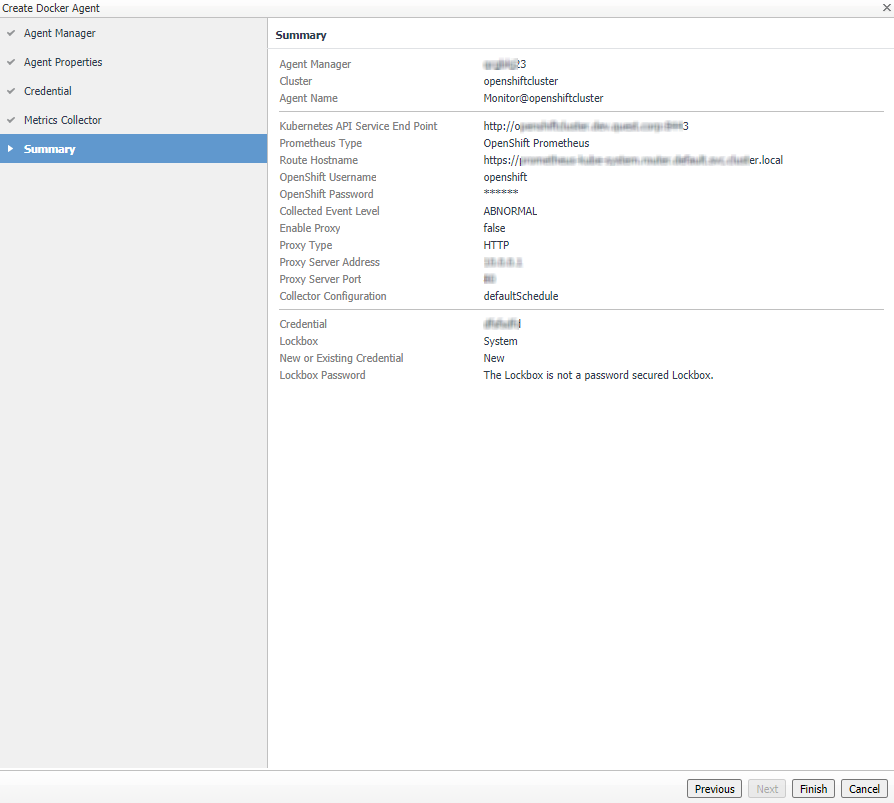
Agent Manager: specify the following values, and then click Next. |
|
• |
Agent Manager: The Kubernetes Agent will be create in the selected Agent Manager. |
|
• |
Cluster Name: Customized cluster name which identifies a Kubernetes cluster. |
|
• |
Agent Name: Auto-generated agent name. You can change the name according to your requirement. It should be a unique name. |
|
• |
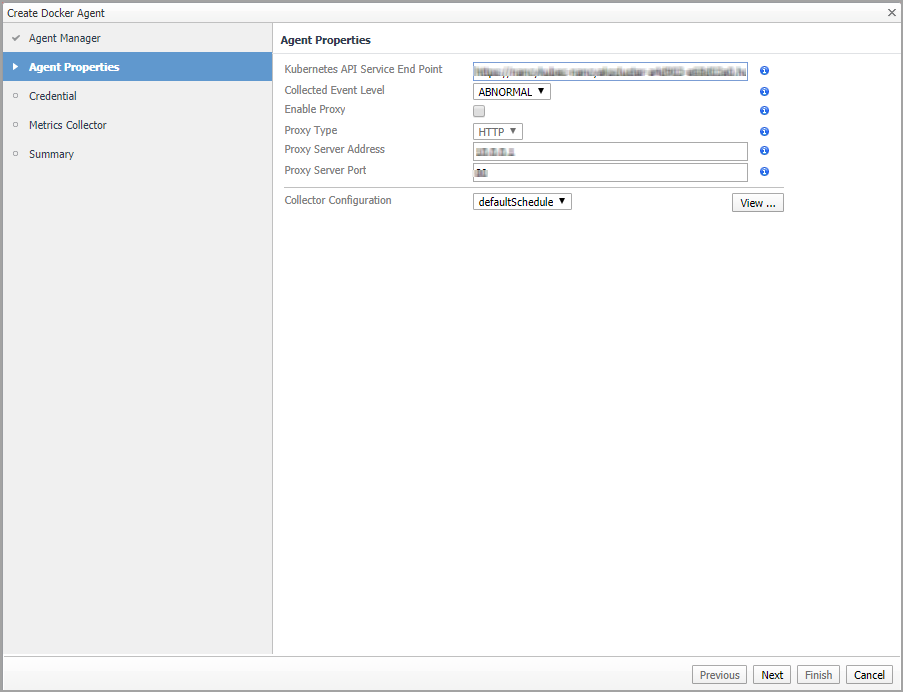
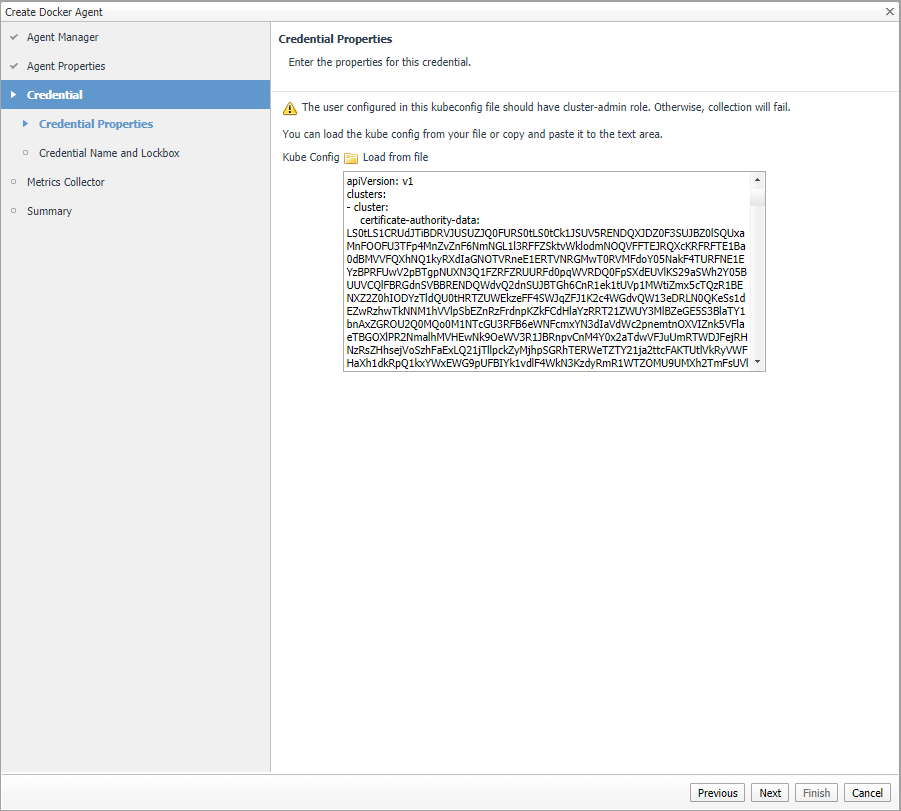
Kubernetes API Service End Point: The format is: http(s)://<url:port>. If you have a Kubeconfig file, retrieve this endpoint from the file (path: clusters -> cluster -> server). If there are multiple clusters, find the current context related cluster server URL. |
|
• |
Collected Event Level: Set the collected event level, including ABNORMAL and ALL. ALL will collect both abnormal and normal events while Abnormal only collects abnormal events. |
|
• |
Enable Proxy: To enable the proxy, select the checkbox. Enter the Proxy Server Address and Proxy Server Port information. |
|
• |
Collector Configuration: Used to configure collection interval for inventory and metrics. You can change the collector intervals of defaultSchedule, however, this will affect all the Kubernetes Agents. Or you can create a new scheduler, configure the collector intervals, and then assign this scheduler to this agent. |
|
• |
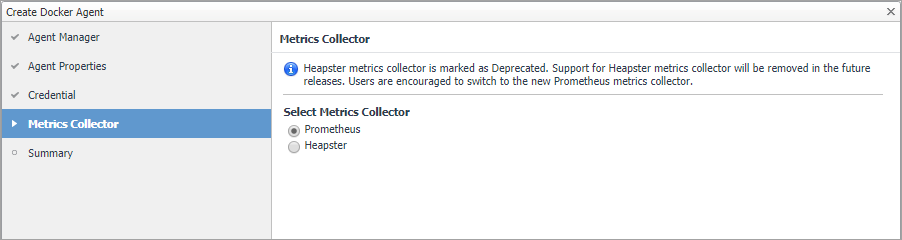
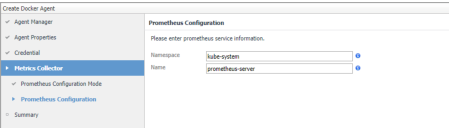
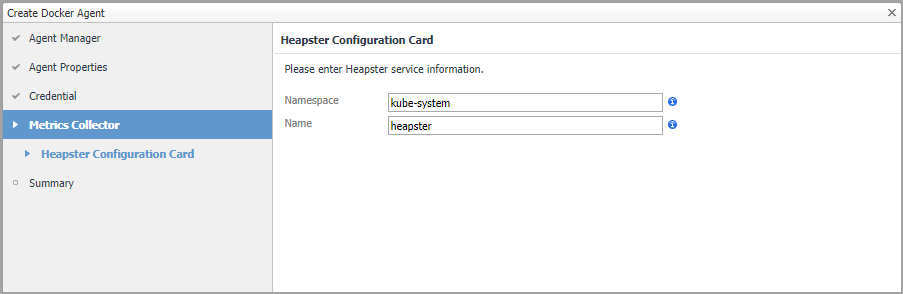
Currently both Prometheus metrics collector and Heapster metric collector are supported. However, users are encouraged to use the Prometheus metrics collector.
|
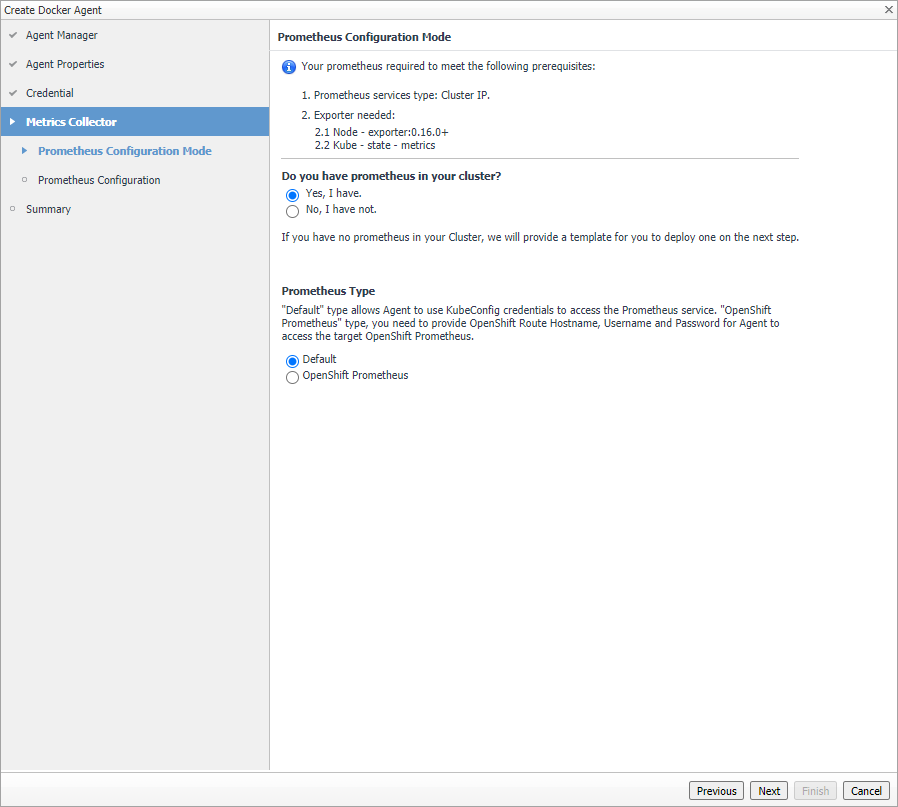
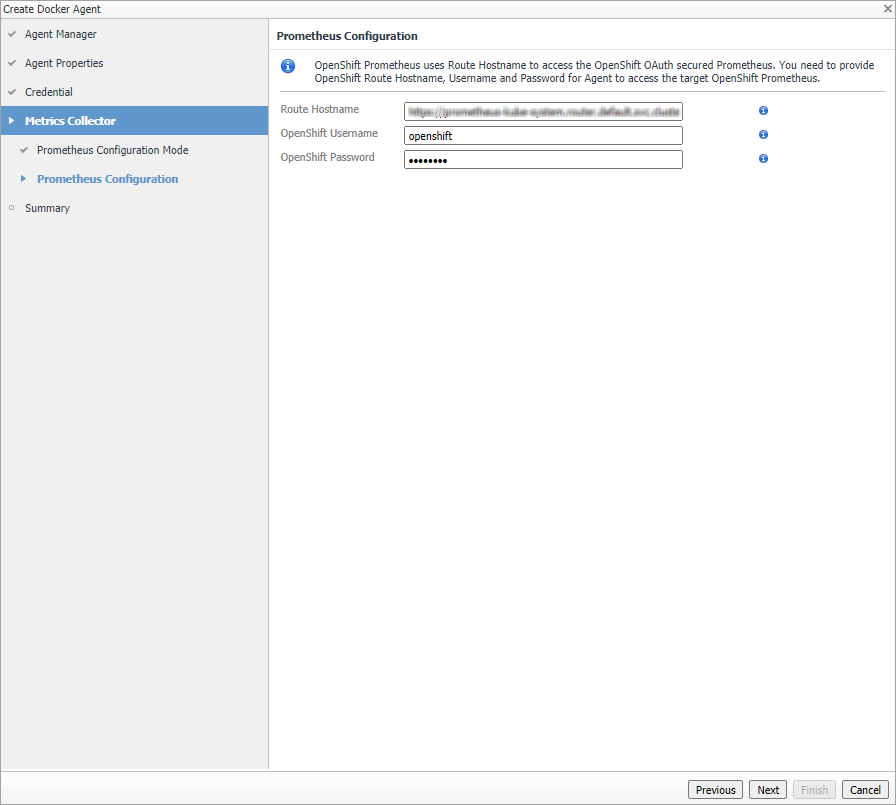
NOTE: To find the Route Hostname, go to the OPENSHIFT ORIGIN dashboard, Application > Routes. Your OpenShift Login User should have the privilege to access to the Prometheus. |
A Prometheus Configuration wizard will appear. To configure the metrics collector, either use the default Prometheus template or upload your own Prometheus deployment .yml files through Load from files.
|
NOTE: Whenever you change the content in Configure file (template), ensure that the Namespace and Name fields are consistent with the Prometheus service configurations in your Configure file (template). If you are using the default template, there is no need to change anything. For a full version of the default template, see https://github.com/Foglight/Container/tree/master/prometheus |
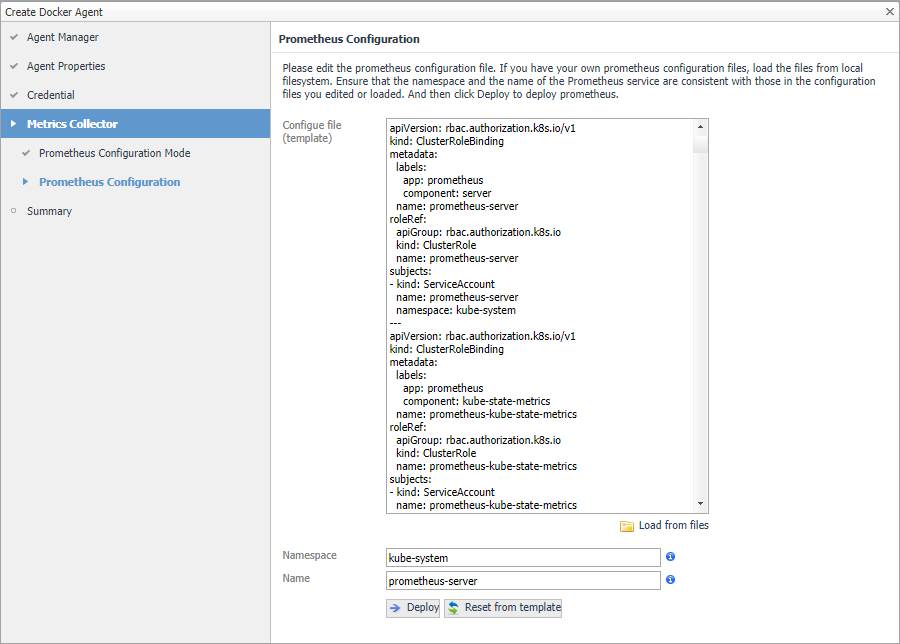
Reset from template: Helps you to reset the Configure file (template) content to the default template.
Deploy: Creates Prometheus components to your cluster with the Configure file.
After clicking Deploy, a progress message will be displayed.
After clicking Deploy, a progress message will be displayed.
|
• |
If deployed successfully, a succeeded message will be displayed. Close the Validation Result page and then click Next to finish your agent creation process. |
|
• |
If failed to deploy the Prometheus configuration, a Validation Result page will be displayed with possible solutions. |
|
8 |
Creating and Activating a Docker Swarm Agent
To create a Docker Swarm agent on a monitored host:
|
2 |
The Agent Status dashboard opens.
|
3 |
The Create Agent wizard opens.
|
4 |
Host Selector: Select the monitored host that you want to monitor with the Docker Swarm agent instance that you are about to create, and then click Next. |
|
5 |
Agent Type and Instance Name: Specify the following values, and then click Next. |
|
• |
Agent Type: Select DockerSwarmAgent from the agent type list. |
|
• |
Agent Name: Specify the name of the agent instance that you are about to create using either of the following approaches: |
|
• |
Generic Name: This option is selected by default. A generic name is a combination of the host name and the agent type and uses the following syntax: agent_type@host_name. |
|
• |
|
6 |
The Agents table refreshes automatically, showing the new Docker Swarm Agent.
|
7 |
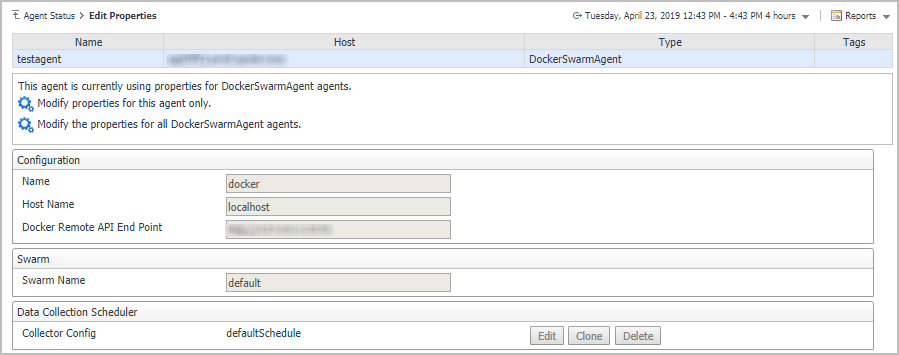
On the Agents table, select the Docker Swarm Agent that you create, click Edit Properties, and then click Modify the private properties for this agent. |
|
8 |
In the Agents properties view, check if the following values have been configured based upon your environment: |
|
• |
Name: give a name to the monitored docker host, it should be unique. |
|
• |
Host Name: IP address or host name of the monitored docker host. |
|
• |
Docker Remote API End Point: Docker Remote API endpoint of the monitored docker host. For more information, see Enabling Docker Remote API for monitored docker host . |
|
• |
Swarm Name: specify the swarm cluster name for display. If the swarm name is kept as “default”, then the cluster name will be displayed as “default (cluster ID)” on the dashboard. If a customized name is input here, then the customized cluster name will be displayed on the dashboard. |
|
9 |
Return back to the Agents table, select the above property changed Docker Swarm Agent, and then click Activate. |
The new Docker Swarm Agent is created and data will be shown on the Monitoring tab after a few minutes.
Configuring data collection interval
|
1 |
|
2 |
On the Agent Status dashboard, select the Kubernetes agent that you use to monitoring the container environment, and then click Edit Properties. |
|
3 |
|
• |
Inventory Collector: Specifies the interval for collecting components. |
|
• |
Metrics Collector: Specifies the interval for collecting metrics. |
|
5 |
Click Save. |
Using Foglight for Container Management
|
• |
|
• |
|
• |
|
• |