View reference
Foglight Net Monitor ships with several dashboards that allow you to monitor and configure your monitored environment. Each of these dashboards contains a number of views. This section describes these views in more detail. For more information about the available dashboards, see Managing monitored network devices and Investigating the performance of network devices.
This cartridge includes the following groups of views:
Net Monitor Devices Management views
The Devices Management dashboard contains the following views:
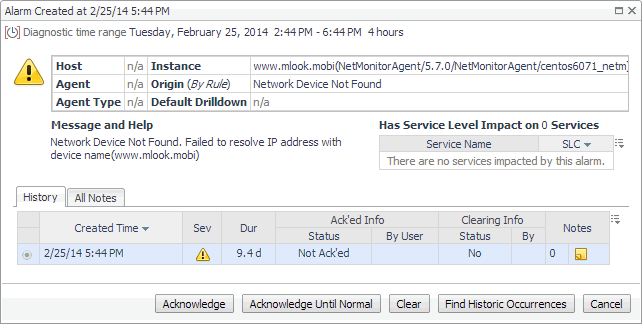
Agent Alarms view
The Agent Alarms view displays the alarms generated against the existing agents.
On the Devices Management dashboard, this view appears just below the Devices Management table.
|
Lists the alarms generated against the monitored locations. NOTE: To acknowledge or clear one or more alarms appearing in this table, select them and click Acknowledge or Clear, as required. For more information about alarms in Foglight, see the Foglight User Guide. | |||||||||||
| |||||||||||
|
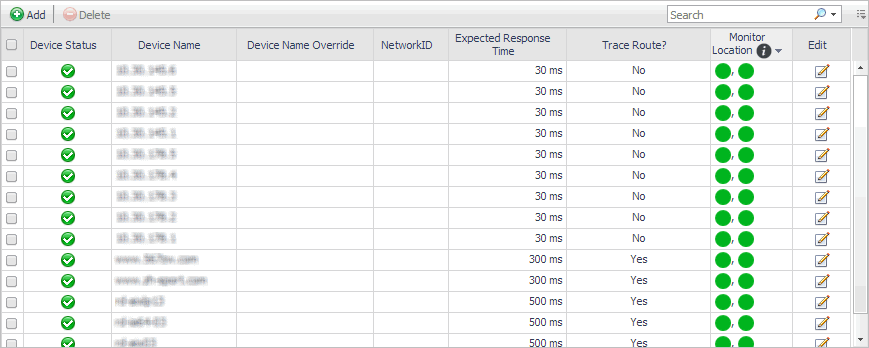
Devices Management table
The Devices Management view displays the monitored network devices.
On the Devices Management dashboard, this view appears just above the Agent Alarms view.
|


