Transaction at a Selected Location drilldown view
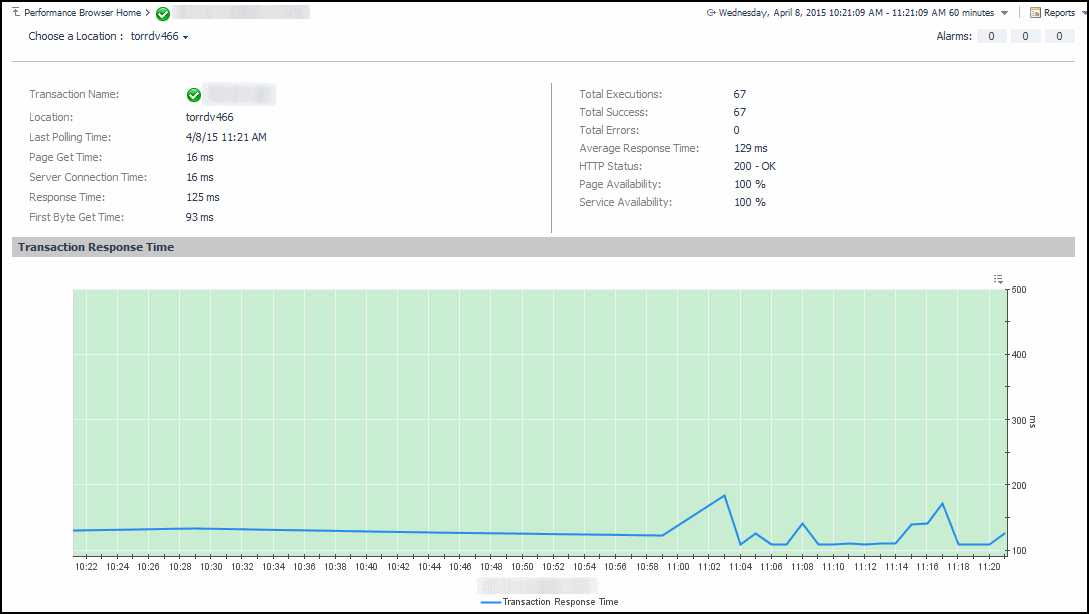
The Transaction at a Selected Location drilldown view provides details about the performance of a transaction monitored from a specific location. This view describe the overall state of the most recent monitoring attempt and response-times recorded during the selected time range, along with its overall health during the monitored time range. Use it to find out how well your Web sites are performing when being monitored from a specific location in your monitoring environment.

This view is made up of the following embedded views:
|
|
Displays details about the selected location. |
|
|
|
• |
Average Response Time. The average amount of time the Web Monitor Agent waits for a response from the monitored Web site. |
|
• |
First Byte Get Time. The time between the Web Monitor Agent detects the first byte of the response from the monitored Web site. |
|
• |
HTTP Status. The HTTP status code, indicating the result of the most recent transaction with the monitored Web site. |
|
• |
Location. The name of the host on which the Web Monitor Agent is running. |
|
• |
Page Availability. The percentage of time the Web site was available when the Web Monitor Agent attempted to collect information from it. |
|
• |
Page Get Time. The amount of time the agent needs to retrieve the data form the monitored Web site. |
|
• |
Response Time. The amount of time the Web Monitor Agent waits for a response from the monitored Web site. |
|
• |
Service Availability. The percentage of time the service was available when the Web Monitor Agent attempted to collect information about this Web site. |
|
• |
Total Errors. The total number of execution attempts that resulted in errors the Web Monitor Agent encountered during the selected time range. |
|
• |
Total Executions. The total number of execution attempts the Web Monitor Agent performed during the selected time range. |
|
• |
Total Executions. The total number of execution attempts the Web Monitor Agent performed during the selected time range. |
|
• |
Total Success. The total number of successful executions the Web Monitor Agent performed during the selected time range. |
|
|
|
Displays the transaction response times over the selected time range.
|
• |
Health History. A color-coded bar, representing the alarm state of the monitored location over the selected time range. The color of the bar changes depending on the alarm state. Red indicates a Fatal state, orange indicates Critical, yellow means Warning, and green is the Normal State. |
|
• |
Transaction Response Time. The amount of time the Web site takes to respond to the Web Monitor Agent request, over the selected time range period. High values in the graph can indicate potential bottlenecks that likely need to be investigated. | |
Transaction at All Locations drilldown view
The Transaction at All Locations drilldown view provides details about the performance of a transaction monitored from all locations to which the Web Monitor Agent is deployed. This view describes how well the Web site responded to monitoring attempts, and shows the response-times recorded during the selected time range. It also lists all of the locations from which this Web site is monitored and indicates the related performance metrics.

|
4 |
In the Transaction at All Locations drilldown view that appears in the display area, click the down-facing arrow on the right of Choose a Location, and select All Locations from the list that appears. |
The Transaction at All Locations drilldown view appears in the display area.
This view is made up of the following embedded views:
|
|
Displays details about all of the locations from which the selected Web site is monitored. |
|
|
|
• |
Average Response Time. The average amount of time all instances of the Web Monitor Agent configured to monitor this Web site wait for a response from the monitored Web site. |
|
• |
Deployed Locations. The names of the hosts running the instances of the Web Monitor Agent configured to monitor this Web site. |
|
• |
Last HTTP Status. The most recent HTTP status code, indicating the result of the most recent transaction with the monitored Web site. |
|
• |
Last Page Availability. The percentage of time the Web site was available when the Web Monitor Agent attempted to collect information from it during the most recent data collection attempt. |
|
• |
Last Response Time. The amount of time the Web Monitor Agent waited for a response from the monitored Web site during the most recent data collection attempt. |
|
• |
Last Sample Location. The name of the host running the Web Monitor Agent instance that performed the most recent data collection from this Web site. |
|
• |
Page Availability. The percentage of time the Web site was available when the Web Monitor Agent instances configured to monitor this Web site attempted to collect information. |
|
• |
Service Availability. The percentage of time the service was available when the Web Monitor Agent instances configured to monitor this Web site attempted to collect information. |
|
• |
Total Errors. The total number of execution attempts that resulted in errors all instances of the Web Monitor Agent configured to monitor this Web site encountered during the selected time range. |
|
• |
Total Executions. The total number of execution attempts all instances of the Web Monitor Agent configured to monitor this Web site performed during the selected time range. |
|
• |
Total Success. The total number of execution attempts that resulted in success all instances of the Web Monitor Agent configured to monitor this Web site encountered during the selected time range. |
|
|
|
Displays the transaction response times over the selected time range.
|
• |
Health History. A color-coded bar, representing the alarm state of the monitored Web site over the selected time range. The color of the bar changes depending on the alarm state. Red indicates a Fatal state, orange indicates Critical, yellow means Warning, and green is the Normal State. |
|
• |
First Byte Get Time. The time between the Web Monitor Agent detects the first byte of the response from the monitored Web site, during the selected time range. |
|
• |
Page Get Time. The average amount of time the monitoring agents take to retrieve the data from the monitored Web site, during the selected time range. |
|
• |
Server Connection Time. The average amount of time the monitoring agents used to connect to the monitored Web sites, during the selected time range. | |
|
|
Displays the transaction response times over the selected time range.
|
• |
Health History. A color-coded bar, representing the alarm state of the monitored location over the selected time range. The color of the bar changes depending on the alarm state. Red indicates a Fatal state, orange indicates Critical, yellow means Warning, and green is the Normal State. |
|
• |
Location. The name of the host on which the Web Monitor Agent is running. |
|
• |
Errors. The number of execution attempts that resulted in errors the Web Monitor Agent configured to monitor this Web site encountered since it started monitoring this Web site. |
|
• |
Executions. The number of execution attempts the Web Monitor Agent configured to monitor this Web site performed since it started monitoring this Web site. |
|
• |
Last Polling Time. The date and time of the most recent data collection attempt the Web Monitor Agent configured to monitor this Web site performed. |
|
• |
Last HTTP Status. The most recent HTTP status code encountered by the Web Monitor Agent configured to monitor this Web site. |
|
• |
Last Response Time. The amount of time the Web Monitor Agent configured to monitor this Web site waited for a response from the monitored Web site during the most recent data collection attempt. | |
|
|
Drill down on:
|
Transaction view
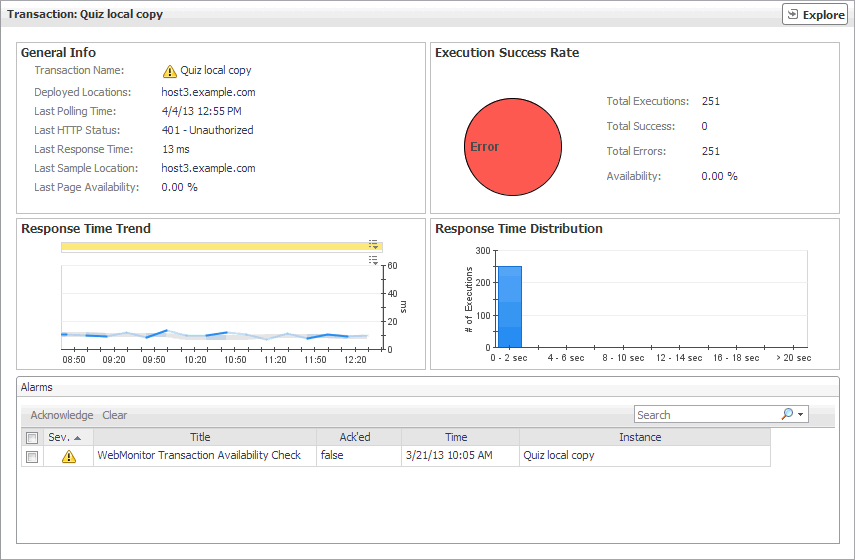
The Transaction view displays overall response and availability information for the selected transaction. Use it to get a better idea of how well this Web site is performing and to investigate potential bottlenecks.
 o
o
The Transaction view appears on the right.
This view is made up of the following embedded views:
|
|
Shows general details about the most recent collection attempt. |
|
|
|
• |
Deployed Locations. The names of the hosts running the instances of the Web Monitor Agent configured to monitor this Web site. |
|
• |
Last HTTP Status. The most recent HTTP status code, indicating the result of the most recent transaction with the monitored Web site. |
|
• |
Last Page Availability. The percentage of time the Web site was available when the Web Monitor Agent attempted to collect information from it during the most recent data collection attempt. |
|
• |
Last Response Time. The amount of time the Web Monitor Agent waited for a response from the monitored Web site during the most recent data collection attempt. |
|
• |
Last Sample Location. The name of the host running the Web Monitor Agent instance that performed the most recent data collection from this Web site. |
|
|
|
Indicates the general success rate the monitoring agents encountered during data collection. |
|
|
|
• |
Availability. The percentage of time the Web site was available when the Web Monitor Agent instances configured to monitor this Web site attempted to collect information. |
|
• |
Total Errors. The total number of execution attempts that resulted in errors all instances of the Web Monitor Agent configured to monitor this Web site encountered during the selected time range. |
|
• |
Total Executions. The total number of execution attempts all instances of the Web Monitor Agent configured to monitor this Web site performed during the selected time range. |
|
• |
Total Successes. The total number of successful execution attempts all instances of the Web Monitor Agent configured to monitor this Web site encountered during the selected time range. | |
|
|
Indicates the time the Web site takes for responding to monitoring requests and its health. |
|
|
|
• |
Health History. A color-coded bar, representing the alarm state of the monitored location over the selected time range. The color of the bar changes depending on the alarm state. Red indicates a Fatal state, orange indicates Critical, yellow means Warning, and green is the Normal State. |
|
• |
Response Time. The amount of time the Web site takes to respond to monitoring requests, over the selected time range. High values in the graph can indicate potential bottlenecks that likely need to be investigated. The grey-shaded area indicates baseline values for this metric, representing the expected value range during the selected time period. | |
Transactions view
The Transactions view lists the names of transactions that are currently monitored, and shows their states.

Selecting All Transactions shows the overall response and availability information for the monitored transactions in the Summary - All Transactions view on the right. Similarly, selecting a transaction in the list shows transaction-specific metrics in the Transaction view on the right.
|
|
|
• |
Alarm severity. The state of the most recent alarm raised against the associated transaction: Warning  , Critical  , or Fatal  . |
|
• |
All Transactions. A parent node for the transaction object instances that appear in this view. |
|
• |
Transaction. The name of the transaction associated with this Web site. | |
|
|
Drill down on:
|